Conversion Rate Optimization (CRO) Services | Turn More Visitors Into Customers
You’re driving traffic to your website—but how much of it converts? The average website conversion rate is just 2-3%, meaning 97% of your visitors leave without taking action. Our Conversion Rate Optimization (CRO) services systematically increase the percentage of visitors who become leads, customers, and revenue—without spending more on traffic.
CRO is the highest-ROI investment in digital marketing. A 1% improvement in conversion rate can double your revenue from the same traffic. We use data-driven experimentation, behavioral analysis, and UX optimization to unlock the hidden revenue already sitting in your website.
📋 CRO Services — Quick Summary
At a glance: everything we deliver through our conversion rate optimization services.
| Service | What We Do |
|---|---|
| Conversion Audit | Analytics deep dive, heatmap analysis, session recordings, user surveys, and heuristic evaluation |
| A/B Testing | Data-backed hypotheses, statistically rigorous tests on landing pages, checkout, forms, and navigation |
| Landing Page Optimization | Message match, persuasive design, form optimization, page speed, and mobile-first design |
| Funnel Optimization | Every stage from awareness to post-conversion, reducing drop-offs at each step |
| Personalization | Traffic source, geo, behavioral triggers, return visitor, and device-specific experiences |
| Industries Served | E-commerce, B2B/SaaS, Healthcare, Professional Services |
| Key Results | 30-100% conversion increase, 20-50% lower CPA, 223% average ROI |
| Investment | $3,000-$20,000/month or $5,000-$10,000 one-time audit |
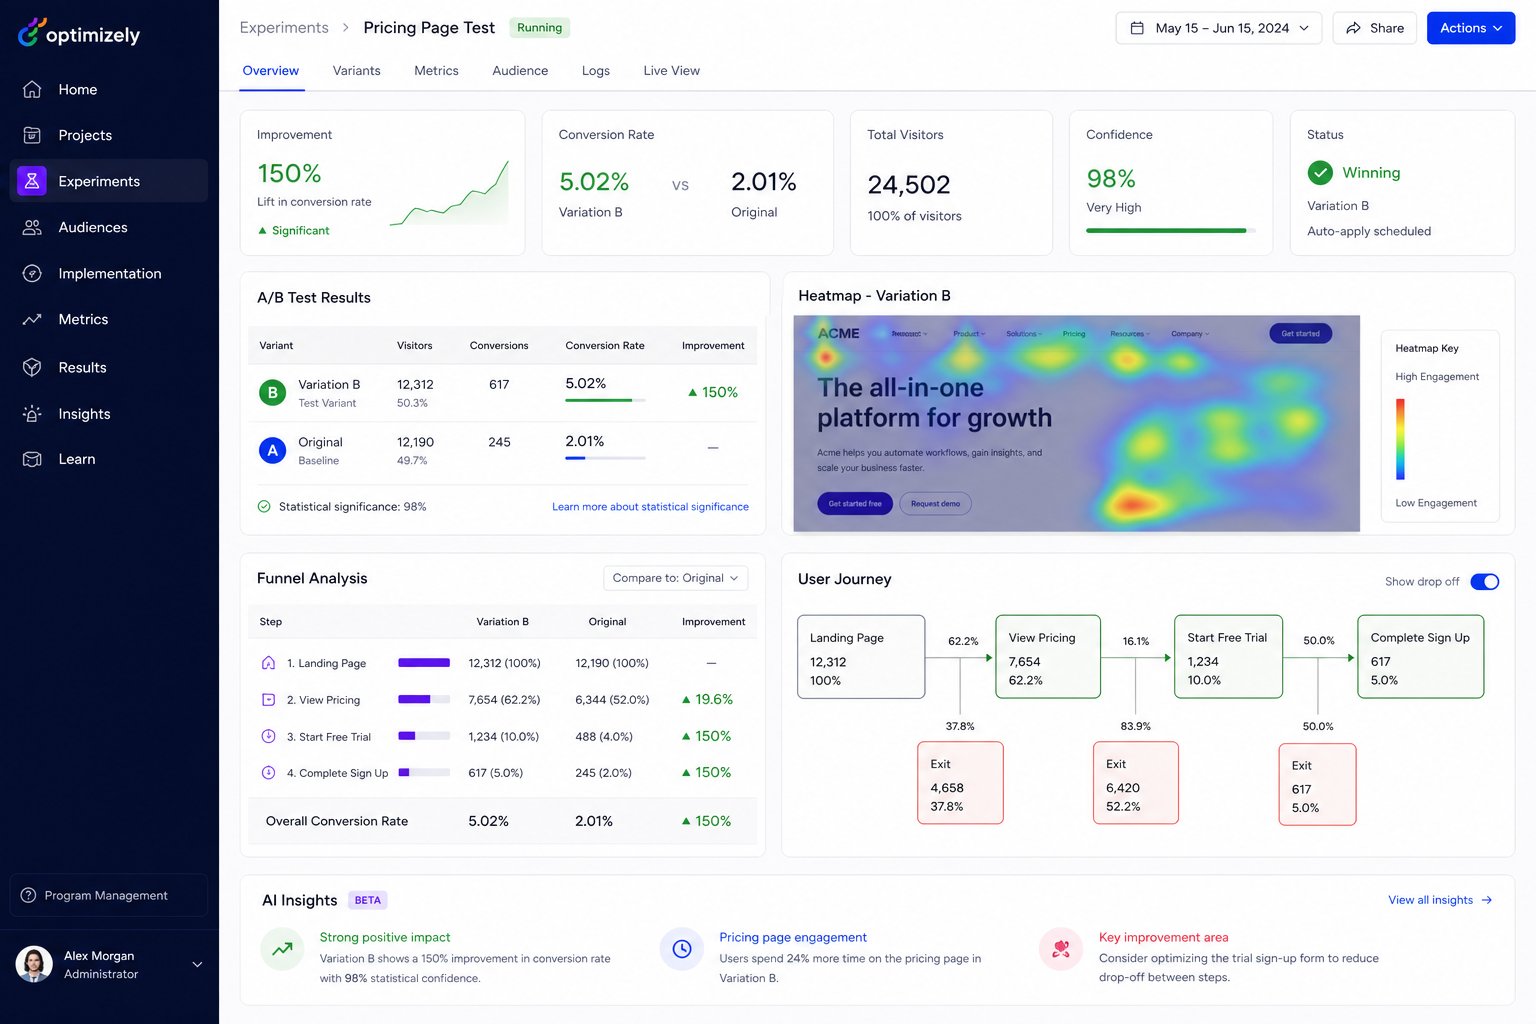
CRO Statistics: Why It’s the Highest-ROI Marketing Investment
| Metric | Data | Impact |
|---|---|---|
| Average website conversion rate | 2.35% | 97.65% of visitors leave without converting |
| Top 25% of sites convert at | 5.31%+ | 2.3x more revenue from same traffic |
| Top 10% of sites convert at | 11.45%+ | 5x more revenue from same traffic |
| Average CRO ROI | 223% | $2.23 return for every $1 invested |
| Companies using CRO | Only 22% | Massive competitive advantage |
| A/B tests that find winners | 1 in 7 tests | Systematic testing is essential |
| Cart abandonment rate | 69.99% | Huge opportunity for optimization |
| Page speed impact (1 second delay) | -7% conversions | Speed = revenue |
Why CRO Is the Highest-ROI Marketing Investment
- Multiply Existing Traffic Value: Double conversions without spending more on ads or SEO. Every visitor becomes more valuable.
- Lower Customer Acquisition Cost: Higher conversion rates mean lower cost per lead and customer across ALL channels simultaneously.
- Data-Driven Decisions: Replace guesswork with statistically validated experiments. Know what works instead of assuming.
- Compounding Results: Every winning test permanently improves your conversion rate. Improvements stack over time.
- Better User Experience: CRO improvements make your site better for all users, reducing friction and confusion.
- Competitive Advantage: Outperform competitors who waste traffic on poorly optimized sites. Only 22% of companies invest in CRO.
- Insights for All Channels: CRO learnings improve every marketing channel simultaneously—what converts on landing pages converts in ads, emails, and social.
- Permanent Improvements: Unlike paid ads that stop when you stop spending, CRO improvements are permanent and compound over time.
Our CRO Services
1. Conversion Audit & Research
We start with deep research to understand why visitors aren’t converting:
- Quantitative Analysis: Google Analytics deep dive into conversion funnels, drop-off points, user flows, and device-specific performance
- Heatmap Analysis: Visual heatmaps showing where users click, scroll, hover, and engage—or don’t
- Session Recordings: Watch hundreds of real user sessions to identify friction points, confusion, rage clicks, and dead clicks
- User Surveys: On-site surveys, exit polls, and post-purchase surveys to understand visitor intent, objections, and satisfaction
- Competitor Analysis: Conversion-focused competitive benchmarking of top 5 competitors’ user experiences
- Technical Audit: Page speed, mobile usability, cross-browser testing, and technical barriers to conversion
- Heuristic Analysis: Expert evaluation using proven frameworks (LIFT, MECLABS) to identify conversion barriers
2. A/B Testing & Experimentation
We run systematic experiments to find what converts best:
- Hypothesis Development: Data-backed hypotheses prioritized by PIE (Potential, Importance, Ease) and ICE (Impact, Confidence, Ease) frameworks
- Test Design: Statistically rigorous A/B and multivariate test designs with proper sample size calculations
- Landing Page Testing: Headlines, hero images, value propositions, CTAs, layouts, forms, social proof, and offers
- Checkout Optimization: Cart page, checkout flow, payment options, trust signals, and shipping information tests
- Form Optimization: Field count, labels, placeholders, validation, multi-step forms, and submission flow testing
- Navigation & UX Testing: Menu structure, search functionality, filters, and information architecture tests
- Pricing Page Testing: Pricing display, plan comparison, free trial CTAs, and guarantee placement
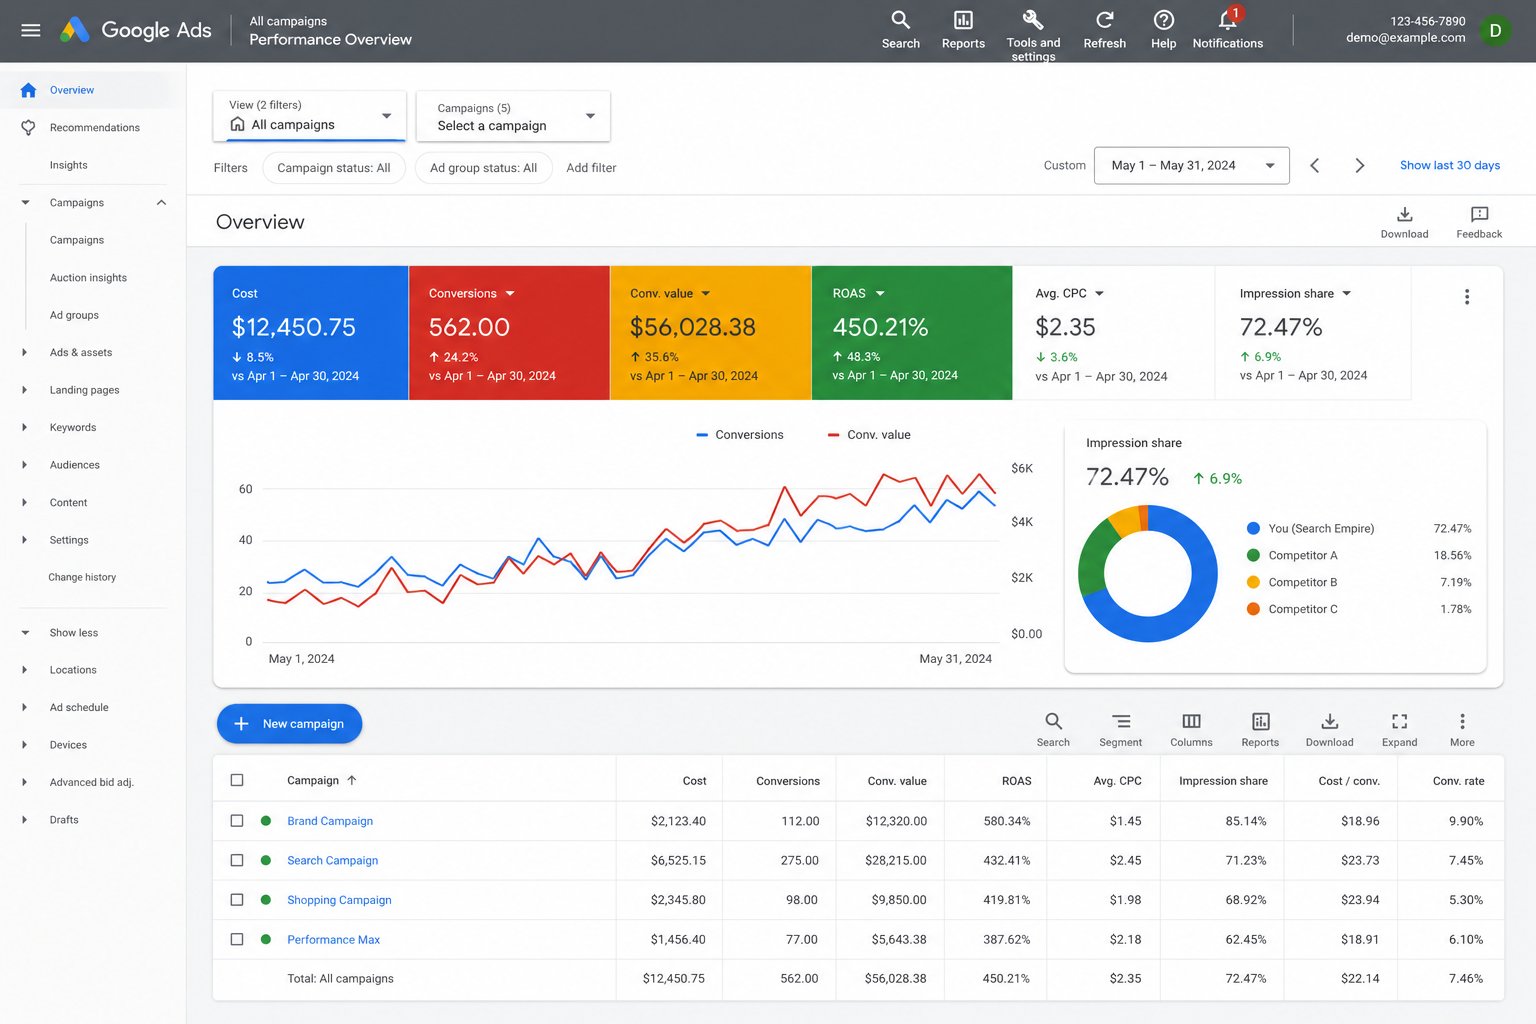
3. Landing Page Optimization
High-converting landing pages are the cornerstone of paid campaign success:
- Message Match: Perfect alignment between ad copy and landing page content—matching headlines, benefits, and CTAs
- Persuasive Design: Visual hierarchy, social proof (testimonials, logos, ratings), urgency, scarcity, and trust signals
- Form Optimization: Minimal fields, progressive profiling, inline validation, auto-fill, and friction reduction
- Page Speed: Sub-3-second load times for maximum conversions—every 1-second delay loses 7% of conversions
- Mobile Optimization: Mobile-first design for the 60%+ of traffic from mobile devices with thumb-friendly CTAs
- Personalization: Dynamic content based on traffic source, location, device, time of day, and behavior
- Video Integration: Product demos and explainer videos that increase conversions by 80%
4. Funnel Optimization
We optimize every step of your conversion funnel to reduce drop-offs:
- Awareness Stage: Ad-to-landing page alignment, first-impression optimization, and above-the-fold content
- Consideration Stage: Content engagement, comparison pages, social proof placement, and objection handling
- Decision Stage: Checkout flow, pricing page, CTA optimization, guarantees, and payment options
- Post-Conversion: Thank you pages, upsells, referral program integration, and onboarding
- Micro-Conversions: Newsletter signups, account creation, add-to-cart, and engagement metric improvements
5. Personalization & Behavioral Targeting
Deliver the right experience to the right visitor at the right time:
- Traffic Source Personalization: Different experiences for organic, paid, social, email, and referral visitors
- Geo-Targeting: Location-specific messaging, offers, shipping information, and currency display
- Behavioral Triggers: Exit-intent popups, scroll-triggered offers, time-based messaging, and inactivity detection
- Return Visitor Recognition: Different experiences for new vs. returning visitors based on previous behavior
- Device Optimization: Tailored experiences for desktop, tablet, and mobile users with device-specific CTAs
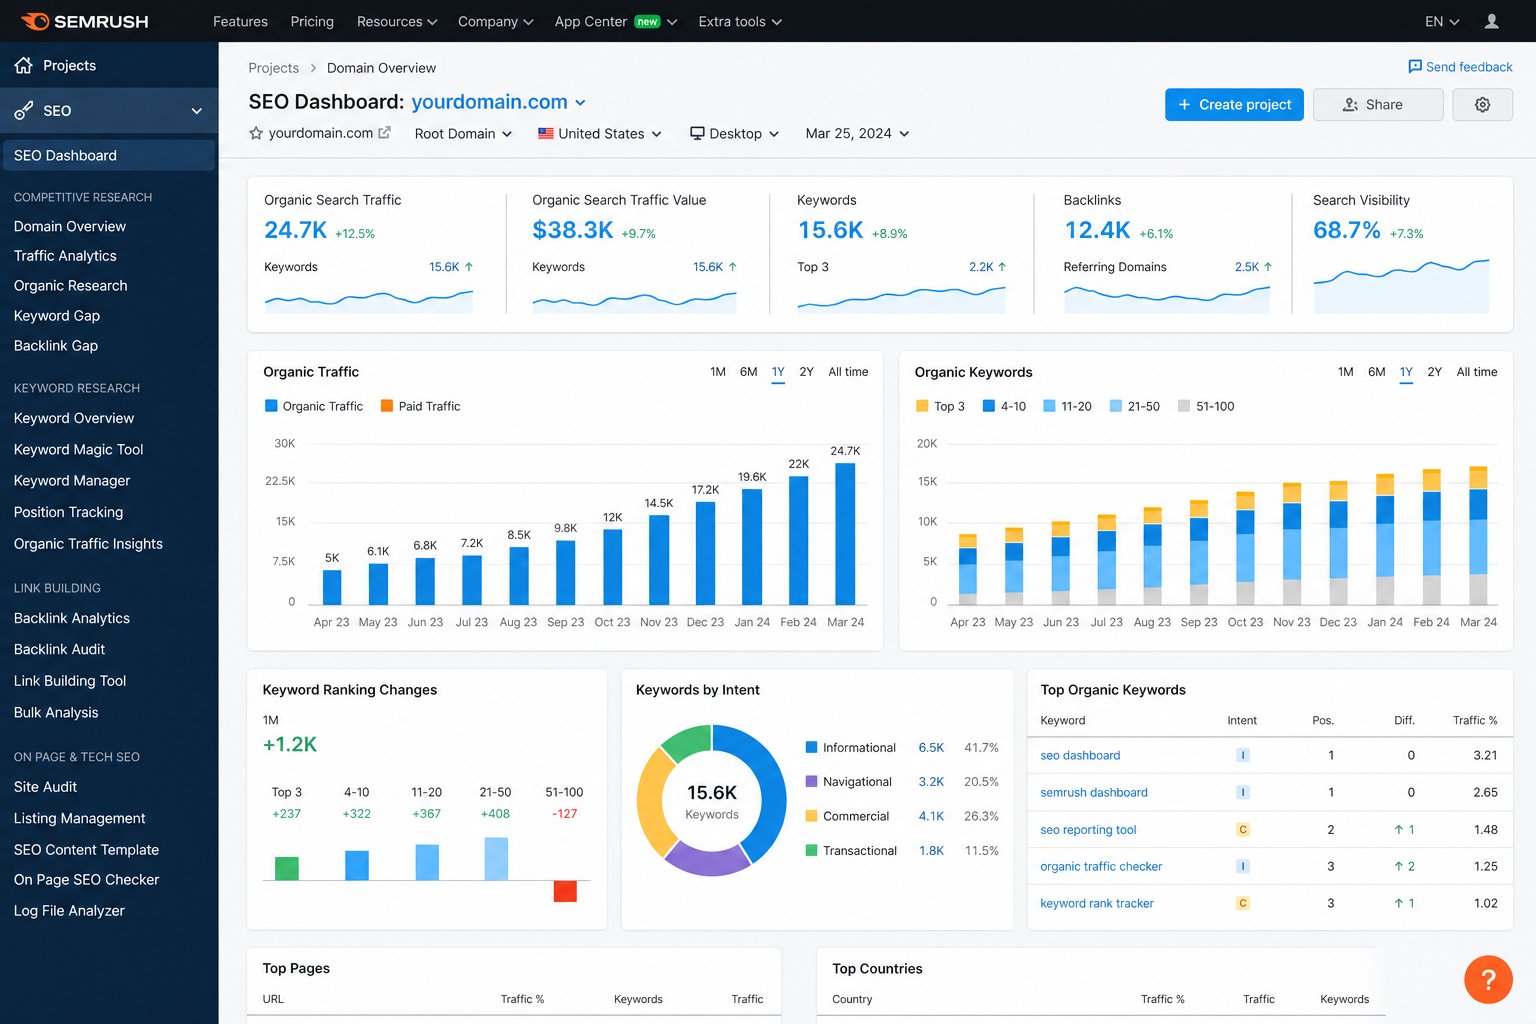
CRO Impact by Page Type
| Page Type | Avg. Conversion Rate | After CRO | Revenue Impact |
|---|---|---|---|
| Landing Pages | 2-5% | 5-12% | ⭐⭐⭐⭐⭐ |
| Product Pages | 1-3% | 3-8% | ⭐⭐⭐⭐⭐ |
| Checkout/Cart | 30-40% (of cart) | 45-60% | ⭐⭐⭐⭐⭐ |
| Pricing Pages | 2-4% | 5-10% | ⭐⭐⭐⭐ |
| Homepage | 1-3% | 3-6% | ⭐⭐⭐⭐ |
| Lead Forms | 3-8% | 8-20% | ⭐⭐⭐⭐⭐ |
CRO by Industry
E-commerce
- Product page optimization with social proof, urgency, and clear CTAs
- Cart abandonment reduction through simplified checkout and trust signals
- Category page optimization for better product discovery and filtering
- Search and filter optimization for improved product findability
- Upsell and cross-sell optimization on product and cart pages
B2B & SaaS
- Demo request and free trial signup optimization
- Pricing page clarity and plan comparison optimization
- Lead form optimization with progressive profiling
- Onboarding flow optimization for activation and retention
- Feature page optimization for upgrade conversions
Healthcare & Professional Services
- Appointment booking flow optimization and calendar integration
- Contact form and consultation request optimization
- Trust signal and credential placement testing
- Patient portal signup and engagement optimization
Our CRO Process
Phase 1: Research & Discovery (Weeks 1-3)
- Analytics audit and conversion funnel analysis (all devices, all traffic sources)
- Heatmap installation (Hotjar/Clarity) and 2-week data collection period
- User research: on-site surveys, session recordings (100+ sessions reviewed), usability testing
- Competitive conversion benchmarking of top 5 competitors
- Heuristic analysis using LIFT and MECLABS frameworks
- Hypothesis generation and prioritization (PIE/ICE framework, 20+ hypotheses)
- Technical audit: page speed, mobile usability, cross-browser compatibility
Phase 2: Testing & Optimization (Ongoing Monthly)
- 2-4 A/B tests running simultaneously across highest-impact pages
- Statistical significance tracking (95%+ confidence required for winners)
- Winner implementation and loser analysis with documented learnings
- New hypothesis generation from test learnings and user behavior data
- Monthly reporting: tests run, wins, lifts, revenue impact, and next priorities
Phase 3: Scale & Expand (Quarterly)
- Expand testing to additional pages and user flows
- Implement personalization and behavioral targeting programs
- Develop conversion-optimized design system for new pages
- Build internal CRO capability and knowledge transfer
CRO Technology Stack
| Tool | Purpose | Key Capabilities |
|---|---|---|
| Google Optimize / VWO | A/B testing platform | Visual editor, statistical engine, targeting |
| Hotjar / Microsoft Clarity | Behavioral analytics | Heatmaps, recordings, surveys, funnels |
| Google Analytics 4 | Conversion analytics | Funnel analysis, attribution, segments |
| Optimizely | Enterprise experimentation | Multi-variate, feature flags, personalization |
| Crazy Egg | Visual analytics | Scroll maps, confetti, overlay reports |
| Unbounce / Instapage | Landing page builders | Rapid prototyping, A/B testing, templates |
CRO Results & ROI
Our CRO clients typically achieve:
- 30-100% increase in conversion rates through systematic testing
- 20-50% reduction in cost per acquisition across all channels
- 223% average ROI on CRO investment within the first year
- 15-30% improvement in average order value through upsell optimization
- 40-60% reduction in cart abandonment rates
- 25-40% more leads from the same website traffic
- 10-25% increase in email signup rates from form optimization
- 3-5 winning tests per quarter that permanently improve conversion rates
CRO Pricing
| Package | Includes | Investment |
|---|---|---|
| Audit & Strategy | Full conversion audit, user research, hypothesis roadmap (one-time) | $5,000-$10,000 |
| Growth | 2 A/B tests/month, heatmap analysis, monthly reporting | $3,000-$6,000/month |
| Scale | 4+ tests/month, personalization, user research, landing pages | $6,000-$12,000/month |
| Enterprise | Full experimentation program, dedicated CRO team, multi-site | $12,000-$20,000/month |
Frequently Asked Questions
How long does CRO take to show results?
Quick wins often appear within 2-4 weeks of the first tests. Significant, compounding improvements typically take 3-6 months of systematic testing. We aim for 3-5 winning tests per quarter.
How much traffic do I need for CRO?
Ideally 5,000+ monthly visitors for meaningful A/B tests with statistical significance. For lower traffic sites, we use heuristic analysis, user research, qualitative insights, and multivariate approaches.
How much does CRO cost?
Our CRO services range from $3,000-$20,000/month depending on site complexity, test volume, and optimization scope. One-time audits start at $5,000.
What’s a good conversion rate?
It varies by industry and page type: E-commerce averages 2-3%, B2B lead gen 3-5%, SaaS free trials 5-7%, landing pages 2-5%. Top performers in every category achieve 2-5x their industry average.
Do you redesign our entire website?
No. CRO is about incremental improvements through testing, not complete redesigns. We test specific elements and implement only what statistically improves conversions.
Can CRO work alongside our other marketing?
Absolutely. CRO amplifies every marketing channel by converting more of the traffic you’re already driving. It’s the force multiplier for SEO, PPC, social media, and email marketing.