
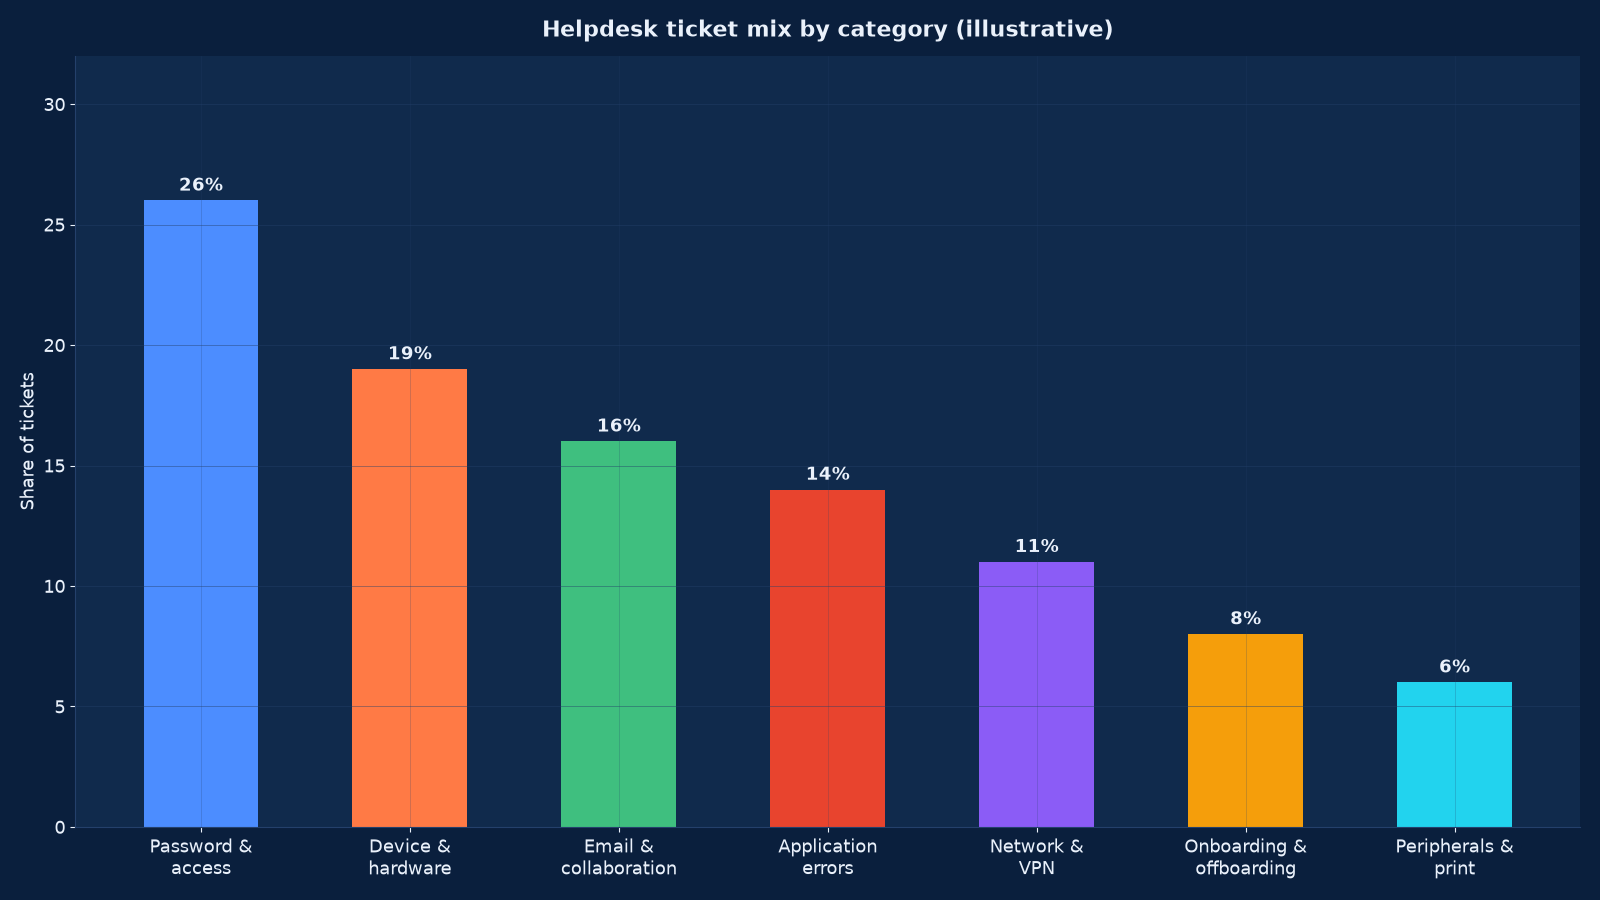
Chart values are an illustrative planning model based on typical UMC engagements and published industry benchmarks. They are not a guarantee of results on any specific project.
The helpdesk is the only part of IT that every employee touches. It is therefore the part they judge the whole function by — and the part most often run as an afterthought, staffed by whoever is free, measured by how fast the queue empties rather than by whether the problem came back.
IT helpdesk and end-user support is the service that keeps people working: a single point of contact, defined response and resolution targets, triage that routes properly the first time, and a deliberate programme to remove recurring tickets rather than absorb them. Unified Management Consulting runs helpdesk as a measured service with tiered support, published SLAs, knowledge management and shift-left automation — so that cost per ticket falls while satisfaction rises, rather than one at the expense of the other.
🎛️ IT Helpdesk & End-User Support — Quick Summary
| Component | What We Deliver |
|---|---|
| Single point of contact | One channel set — portal, email, phone and chat — with everything recorded as a ticket. Corridor requests and direct messages become tickets too, or they become invisible work. |
| Tiered support model | Tier 1 for triage and known solutions, Tier 2 for application and system problems, Tier 3 for infrastructure and vendor escalation, with defined handover criteria rather than guesswork. |
| SLA by priority | Response and resolution targets set by business impact, measured and reported, with escalation triggered automatically rather than by complaint. |
| Knowledge management | A maintained knowledge base of known errors and fixes, written during resolution rather than afterwards, and used by both agents and end users. |
| Self-service & automation | Password reset, access requests, software installation, device enrolment and common fixes automated or self-served, with the volume removed tracked as a metric. |
| Asset & licence administration | Endpoint inventory, assignment, lifecycle, warranty tracking and licence allocation managed through the service desk. |
| Onboarding & offboarding | Joiner, mover and leaver processes with checklists, access provisioning, equipment logistics and de-provisioning evidence. |
| Problem management | Recurring tickets investigated to root cause and permanently removed, with a known-error database and a tracked reduction in repeat volume. |
| Reporting & improvement | Monthly reporting on volume, mix, SLA performance, satisfaction, first-contact resolution and cost per ticket, with an improvement backlog that is actually worked. |
The helpdesk is the user-facing layer of the managed IT service and depends on the same asset register and runbooks. Where the recurring tickets are security events, they belong with Cybersecurity Services; where they are infrastructure faults, with Computing, Server, Storage & Data Centre Engineering and Network Engineering.
What a Bad Helpdesk Actually Costs
Poor support rarely shows up as a support problem. It shows up as lost productive hours, workarounds that become permanent, and staff who stop reporting issues because reporting has never worked.
| Failure | What the business experiences | Underlying cause |
|---|---|---|
| No single channel | Requests vanish; the same problem is raised three ways and tracked once | Corridor requests and direct messages are not converted into tickets |
| Triage by guesswork | Tickets bounce between teams, each adding a day | No categorisation standard and no routing rules |
| First-contact resolution is low | Simple issues escalate unnecessarily and take days | Tier 1 has no knowledge base and no authority to act |
| The same ticket recurs monthly | Users stop reporting and work around it | Incidents are closed without problem management |
| No visibility for managers | Nobody knows the queue state until someone complains | No reporting cadence and no dashboard |
| Onboarding is chaotic | New starters wait days for access and equipment | No standard joiner process and no access request workflow |
| Satisfaction is unmeasured | The service is judged by the loudest complaint | No CSAT capture and no trend data |
| Cost per ticket is unknown | Outsourcing decisions are made on price alone | No volume, effort or allocation data |
The least visible cost is the workaround. When a request takes three days, people find another route — a personal account, an unapproved tool, a spreadsheet outside the system. That is how shadow IT is created, and it is far more expensive to unwind than the original request would have been to fulfil. AI Governance, Risk & Compliance addresses the same dynamic for AI tools specifically.
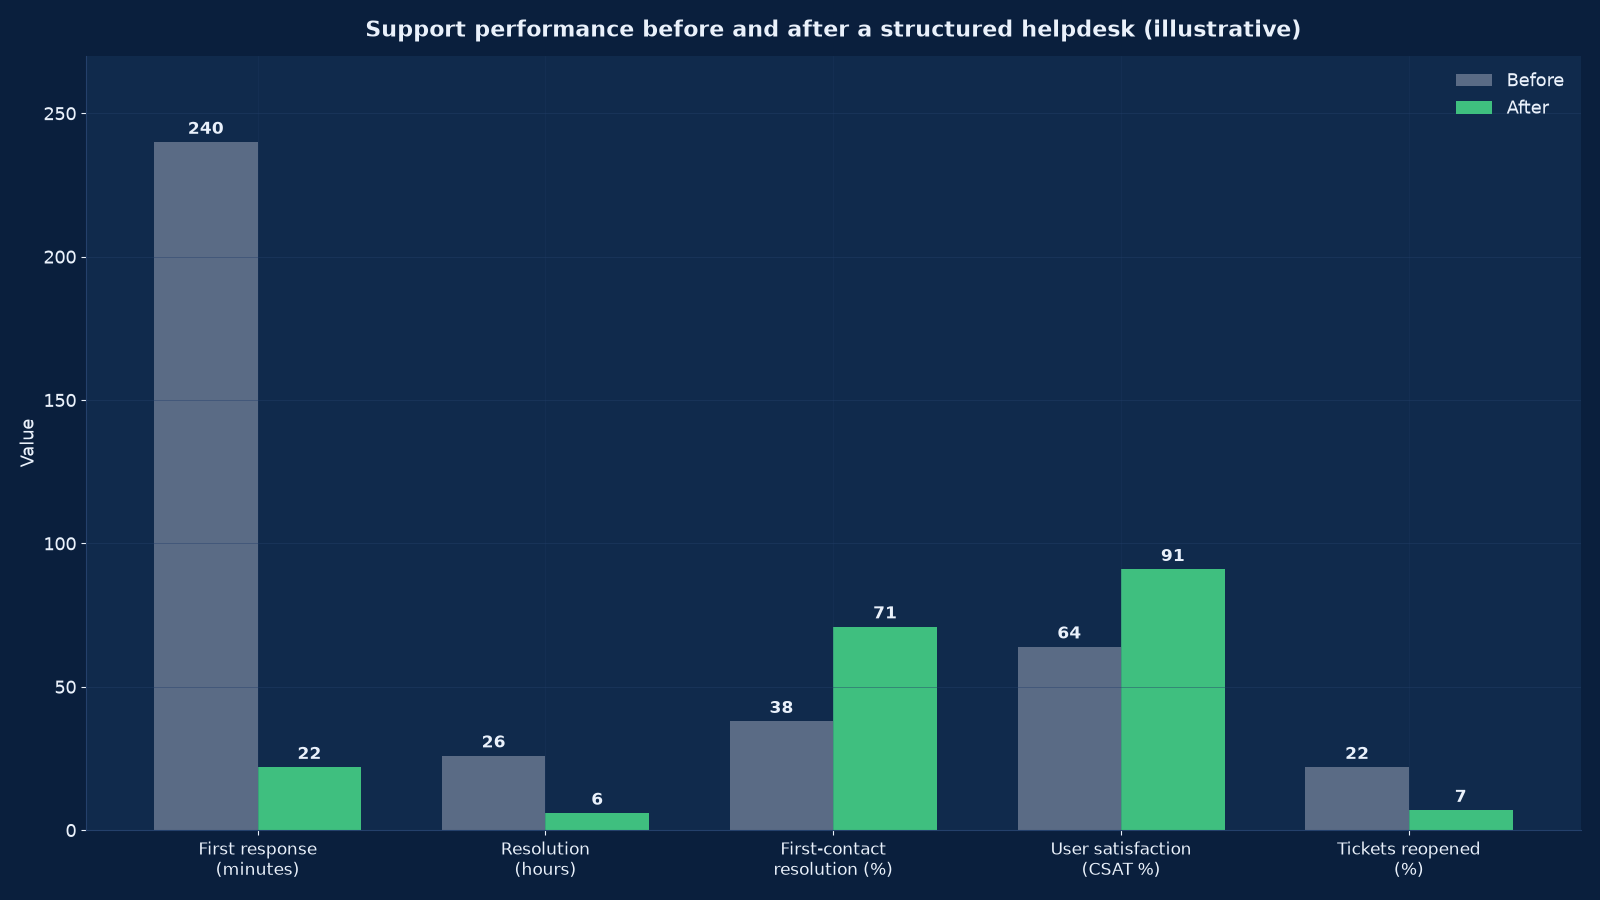
Chart values are an illustrative planning model based on typical UMC engagements and published industry benchmarks. They are not a guarantee of results on any specific project.
The Tiered Support Model
Tiering is not about seniority; it is about authority and information. Each tier needs to know what it is allowed to change and what it must hand over.
| Tier | Handles | Skills required | Authority | Escalates when |
|---|---|---|---|---|
| Tier 0 — Self-service | Password reset, software catalogue, how-to articles, status pages, automated diagnostics | None — designed for the end user | n/a | The self-service route fails or the request is out of catalogue |
| Tier 1 — Service desk | Triage, categorisation, known-error fixes, access requests, endpoint issues, basic application support | Broad and shallow; strong knowledge base use | Reset, reinstall, re-image, standard access changes | Not resolved in the agreed time, or requires privileged change |
| Tier 2 — Technical support | Application problems, server and service issues, complex endpoint and network faults, configuration changes | Deep in specific platforms | Non-production change, scripted remediation, configuration edits | Infrastructure-level fault, vendor defect, or change requiring approval |
| Tier 3 — Specialist / infrastructure | Architecture-level faults, security incidents, database and platform problems, vendor escalation | Specialist engineering | Production change under change control | Vendor fault requiring a support case, or a design change |
Two design points matter more than the tier count. Handover criteria must be explicit — “escalate if not resolved in four hours” beats “escalate if it seems hard”, because the second produces both over- and under-escalation. Knowledge must flow downwards: every Tier 2 and Tier 3 resolution that could have been handled at Tier 1 should produce a knowledge article, or the tiering never improves.
Priorities, SLAs and the Request-versus-Incident Distinction
The most common measurement error is mixing service requests with incidents. A request for a new monitor is not a fault, and averaging it with outages distorts both numbers.
| Priority | Definition | Response | Resolution | Escalation |
|---|---|---|---|---|
| P1 — Critical | Business stopped, or a security or safety issue affecting many users | 15 minutes, 24×7 | 4 hours | Immediate management notification; hourly updates until resolved |
| P2 — High | Major function degraded for a group, or a single user fully blocked | 1 hour | 8 business hours | Notification at 50% of the resolution target |
| P3 — Medium | Partial loss of function with a workaround available | 4 business hours | 3 business days | Notification at breach |
| P4 — Low | Cosmetic issues, questions, non-urgent requests | 1 business day | 10 business days | Reviewed in the monthly backlog |
| Service request | A standard, pre-approved request — access, software, equipment | Per catalogue commitment | Per catalogue commitment | Tracked separately from incidents; a request is not a fault |
Priority should be derived from impact and urgency using a matrix rather than asserted by the reporter, otherwise everything arrives as P1. Publish the matrix, apply it at triage, and review any disagreement as a training signal rather than a conflict.
Shift-Left: Removing Tickets Rather Than Resolving Them Faster
Shift-left means moving resolution to the lowest viable tier, and ultimately to the user. It is the only lever that reduces cost without reducing service, because every other lever trades one against the other.
- Self-service password and account management. The single highest-yield automation available, given Figure 1. Password and access requests typically fall by most of their volume within a quarter of enabling proper self-service.
- A software catalogue with automated fulfilment. Pre-approved applications installable without a ticket, with licence allocation handled automatically.
- Device enrolment and provisioning automation. Zero-touch enrolment so a new starter’s device arrives configured, removing several tickets per joiner.
- Knowledge base articles written at resolution time. Not afterwards, not by a separate team — the resolving agent writes it while the fix is fresh, and it is reviewed before publication.
- Proactive notification. Known outages and maintenance published to a status page and pushed to affected users, which removes the flood of duplicate reports.
- Problem management on recurring tickets. Anything appearing three times in a month gets a root-cause investigation with a permanent fix, tracked as a backlog item.
- Chat and automation for triage. Guided triage that categorises and routes before a human is involved, so Tier 1 receives a well-formed ticket.
Figure 3 shows the effect over six quarters: Tier 1 volume falls, self-service resolution rises, and cost per ticket drops as a consequence rather than as a target. The sequence matters — driving cost per ticket down before self-service exists simply moves work onto users who then abandon the channel.
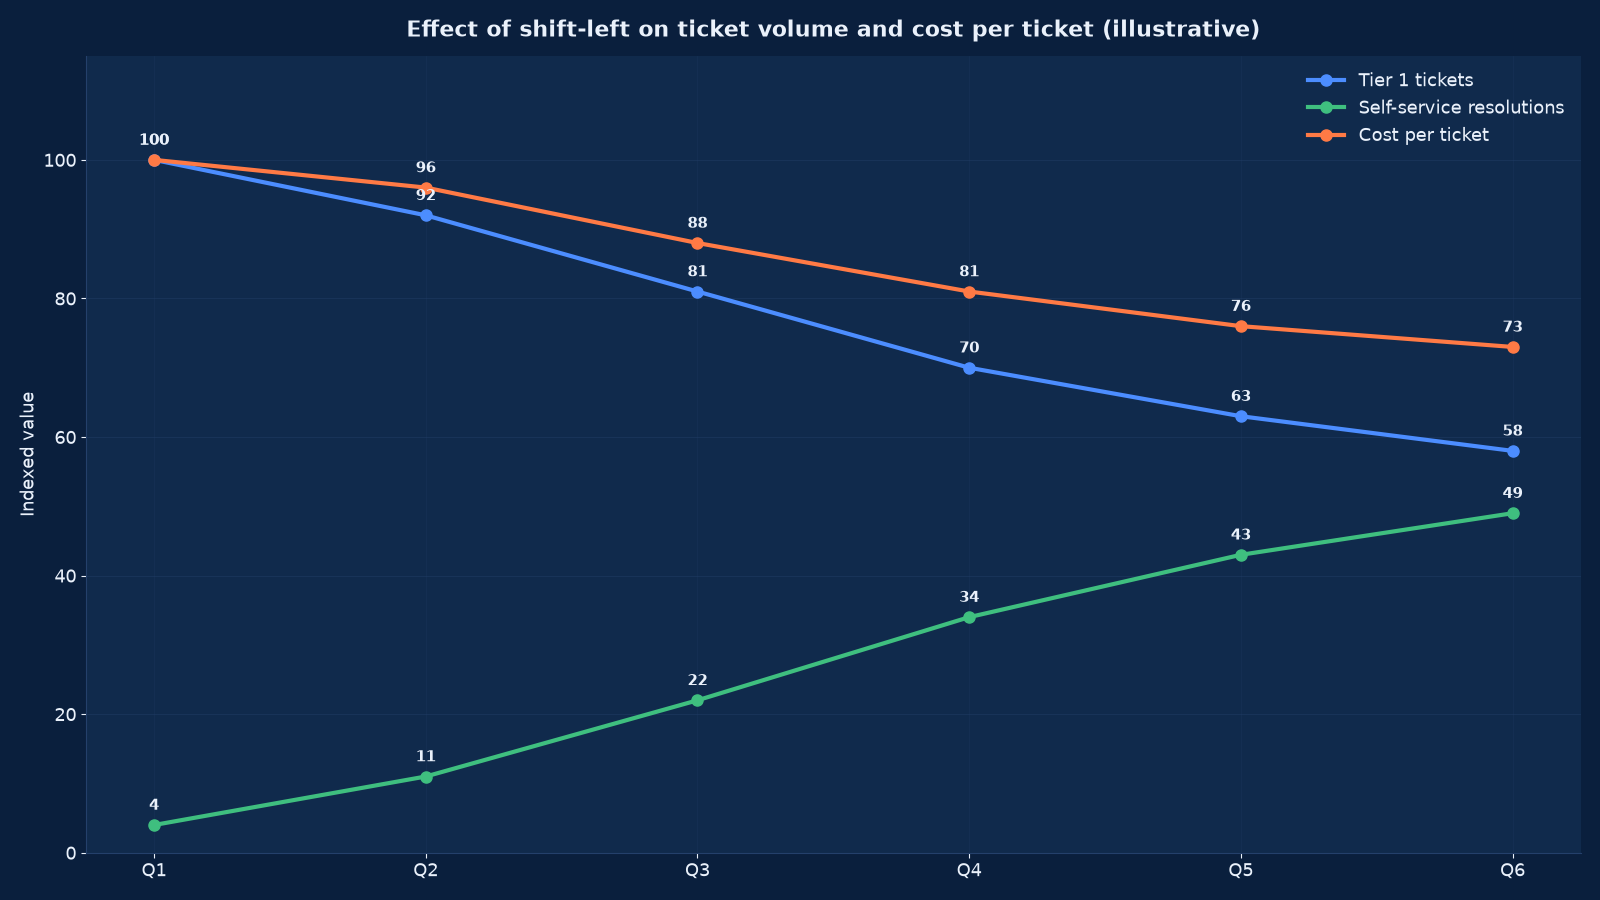
Chart values are an illustrative planning model based on typical UMC engagements and published industry benchmarks. They are not a guarantee of results on any specific project.
Measuring the Service
These are the measures we report monthly. Each one is paired with the metric that stops it being gamed, because every support measure can be optimised dishonestly if read alone.
| Metric | Definition | Target | Read it with |
|---|---|---|---|
| First response time | Ticket creation to first agent action | Per priority; minutes for P1 | Volume — a fast response to a mis-triaged ticket is waste |
| Resolution time | Ticket creation to confirmed resolution | Per priority | Reopen rate, since fast closure with reopens is not fast resolution |
| First-contact resolution | Share resolved at first interaction without escalation | 65–75% | Tier 1 authority and knowledge base quality |
| Reopen rate | Share of closed tickets reopened within a defined window | Under 10% | Closure discipline and whether users are asked to confirm |
| CSAT | User rating captured at closure | Above 85% | Response rate — a high score from five per cent of users means little |
| Ticket volume by category | Counts per category with trend | Falling for automatable categories | Business growth, since volume can rise legitimately |
| Self-service resolution rate | Share of needs met without a ticket | Rising quarter on quarter | Abandonment — users leaving self-service to raise a ticket |
| Cost per ticket | Fully loaded support cost divided by tickets handled | Falling | Mix — a fall caused by trivial tickets is not an efficiency |
| Backlog age | Tickets open beyond their resolution target | Near zero | Priority accuracy |
| Repeat incident rate | Share of tickets matching an existing known error | Falling | Problem management effectiveness |
The pairing matters. First response time without volume data rewards fast acknowledgement of the wrong tickets. CSAT without response rate rewards a small sample of happy users. Cost per ticket without mix data rewards deflecting hard work. Report them together or not at all.
Resourcing Models
| Model | How it works | Advantage | Watch out for |
|---|---|---|---|
| In-house desk | Your employees, your tools, your process | Domain knowledge, cultural fit, direct control | Coverage gaps, single-person dependencies, higher unit cost at low volume |
| Fully outsourced | A provider runs the whole service to an SLA | 24×7 coverage, predictable cost, scale | Domain knowledge has to be taught; quality depends on the knowledge transfer |
| Co-managed | Provider covers out-of-hours, overflow or Tier 1; you keep Tier 2 and 3 | Best of both; retains internal knowledge | Handover definitions must be per task, not per system |
| Follow-the-sun | Geographically distributed teams handing over across time zones | Genuine 24×7 without night shifts | Handover quality is everything; context loss is the main failure |
| Managed service bundled with infrastructure | The helpdesk is part of a wider AMC covering endpoints, servers and network | One accountable provider, shared asset register and runbooks | Scope must be explicit about what is included per asset class |
Tooling: What Actually Matters in a Ticketing Platform
Tool choice rarely determines service quality, but the wrong tool makes good practice difficult. Six capabilities are worth paying for.
- A real self-service portal with search that finds things. If users cannot find the article, they raise a ticket and the shift-left investment is wasted.
- Automation and workflow rules. Routing by category, priority from an impact/urgency matrix, SLA clocks with automatic escalation, and approval workflows for standard requests.
- Asset and configuration linkage. A ticket attached to the device, user and service it concerns is diagnostic; an unattached ticket is a description.
- Knowledge management in the agent workflow. Article creation and linking inside the ticket, not in a separate system nobody opens.
- Reporting that a manager can read. The metric set above, with trend, exportable without a consultancy engagement.
- Integration with identity and endpoint management. So password reset, access provisioning and device state are automated rather than typed.
The most common tooling mistake is buying for features rather than for the workflow the team will actually follow. A simpler tool used properly beats a comprehensive one used as an email archive. Where identity is the constraint, that is an architecture question covered in our systems integration service.
Onboarding and Offboarding: The Process Everyone Notices
Joiner, mover and leaver processes are the highest-visibility work the service desk does, and the most common source of both frustration and security findings.
| Stage | What should happen | Common failure |
|---|---|---|
| Pre-boarding | Equipment ordered and configured, accounts created, access mapped to role, start-day checklist issued | Everything starts on day one, so day one is spent waiting |
| Day one | Device issued and enrolled, credentials handed over securely, first-day orientation, access verified against the role | Credentials sent by email; access granted broadly “to save time” |
| First week | Application access confirmed, training booked, any gaps closed, feedback captured | No follow-up, so gaps become permanent workarounds |
| Mover | Access reviewed against the new role, old entitlements removed | Entitlements accumulate — the single most common access-control audit finding |
| Leaver | Access removed on the effective date, equipment recovered, data ownership transferred, evidence retained | Removal happens days later, or evidence of removal does not exist |
| Contractor and supplier | Time-boxed access with an expiry date and a named sponsor | No expiry, so contractor access outlives the contract |
The mover and leaver stages are where compliance frameworks focus, because they are the easiest to test and the most frequently failed. An auditor sampling joiners, movers and leavers will find the gaps quickly, and access review evidence is a standing requirement under the frameworks covered in our IT audit and compliance service.
Problem Management: The Discipline That Reduces Volume
Incident management restores service. Problem management stops the incident recurring. Organisations that do only the first run a helpdesk that gets busier every year at constant quality.
The practice is small and specific. Anything recurring three or more times in a month is raised as a problem record with an owner. Root cause is established from the tickets and the configuration data, not from opinion. A permanent fix is scheduled as a backlog item with a target date. Until the fix lands, a known-error record documents the workaround so Tier 1 can resolve fast rather than escalate.
Three signals tell you whether it is working: the repeat incident rate falls, the known-error database is used rather than merely maintained, and average resolution time drops without first-contact resolution dropping with it. If resolution time falls while reopens rise, that is closure discipline failing, not problem management succeeding.
Problem management is also where the helpdesk earns its keep against automation. A chatbot can deflect a password reset; it cannot notice that the same VPN failure has appeared eleven times this month and trace it to a certificate expiring next week. That pattern recognition is the part of the service worth investing in, and it is the same discipline our AI Integration into ERP, CRM & Operations service applies to operational processes more broadly.
Evaluating a Support Provider
| Question | Good answer | Warning sign |
|---|---|---|
| How do you triage? | A published categorisation standard and routing rules applied at first contact | “The agent decides” |
| What is your first-contact resolution rate? | A number, with trend, and an explanation of what Tier 1 is authorised to do | No number, or a number above ninety per cent (usually measured wrongly) |
| How do you handle out-of-hours? | A named rota with defined wake-up criteria | An answering service taking messages |
| What does your knowledge base look like? | Searchable, reviewed on a cadence, written by resolving agents | A folder of documents last updated two years ago |
| How do you reduce volume? | A shift-left plan with self-service targets and problem management | “We hire more agents when it gets busy” |
| What do you report monthly? | The metric set above, with pairings and trend | Ticket counts |
| How is satisfaction measured? | CSAT at closure with the response rate reported | An annual survey |
| How do we exit? | Knowledge transfer, ticket history export, tooling handover, transition period | No exit clause |
AI in the Helpdesk: What Works and What Does Not
AI assistance in support is genuinely useful in four places and actively harmful in two.
What works: suggested articles and similar past tickets at triage, which shortens diagnosis; summarisation of long ticket threads for the next agent; categorisation and routing at intake; and draft responses for the agent to review, which is where most of the time saving actually is.
What does not: fully autonomous customer-facing resolution without a retrieval layer grounded in your own knowledge base, which produces confident wrong answers; and automated closure, which destroys the reopen metric and hides unresolved problems.
The determinant of whether AI helps is almost never the model — it is whether the knowledge base underneath is clean, current and permission-aware. That is the work described in Data Engineering for AI: RAG & Knowledge Systems, and the deployment discipline is in AI Agent Deployment & Automation. Where you are considering it, measure the baseline first using the approach in our AI ROI Measurement & Executive Scorecards service, because the benefit claim is easy to make and hard to verify without it.
Engagement Models
| Model | Duration | Deliverables | Best when |
|---|---|---|---|
| Support service assessment | 2–4 weeks | Volume and mix analysis, SLA position, first-contact resolution and cost per ticket baseline, tooling review, prioritised improvement plan | Support is failing or you are deciding whether to outsource |
| Helpdesk design & launch | 8–12 weeks | Tiering model, priority matrix, SLAs, categorisation standard, knowledge base foundation, tooling configuration, reporting and agent training | Building a service desk from nothing, or rebuilding one properly |
| Shift-left programme | 10–16 weeks | Self-service portal, password and access automation, software catalogue, device enrolment, knowledge base build, problem management process, measured volume reduction | Volume is high and rising with no route to reducing it |
| Managed helpdesk | Ongoing | Tiered support to published SLAs with monthly reporting, knowledge management and an improvement backlog | You want the service operated rather than designed |
| Joiner-mover-leaver automation | 4–8 weeks | Standard processes, identity integration, access request workflow, de-provisioning with evidence retention | Onboarding is slow, or access review is producing audit findings |
What a Good Helpdesk Looks Like a Year On
The service has worked when nobody talks about it. Concretely:
- One channel set, with everything recorded as a ticket — including the requests that used to arrive by corridor.
- First-contact resolution above two thirds, because Tier 1 has a knowledge base and the authority to use it.
- Password and access tickets largely gone, replaced by self-service that users prefer.
- Repeat incident rate falling quarter on quarter, because problem management closes causes.
- Onboarding that takes an hour rather than a week, with offboarding producing evidence an auditor accepts.
- CSAT above eighty-five per cent with a response rate high enough to mean something.
- Cost per ticket falling because volume is falling, not because agents are being pressed.
- A monthly report a non-technical manager can read, with an improvement backlog that is actually worked.
The last point determines whether any of the others survive. Support quality decays without a review cadence, because the pressure is always to absorb volume rather than remove it. Where the helpdesk is part of a wider managed IT contract, that cadence should be in the contract rather than dependent on someone remembering — and where the estate is also being consolidated, fewer systems means fewer ticket categories, which is the most durable shift-left of all.
Frequently Asked Questions About IT Helpdesk & End-User Support
What does IT support cost per user?
It depends on tier coverage, hours, endpoint mix and how much has been automated. The useful comparison is not against a market rate but against your own cost per ticket and your ticket volume per user, both of which the assessment establishes in the first two weeks. Organisations that buy on price per user alone usually discover they have purchased response time without resolution capability.
Should we outsource the helpdesk?
Outsource where you need coverage you cannot staff — out-of-hours, 24×7, or seasonal peaks — or where volume is too low to justify a dedicated team. Keep in-house or co-manage where domain knowledge is deep and hard to transfer, which is typical in specialist or regulated environments. Co-managed is the most common answer: the provider takes Tier 1 and out-of-hours, you keep Tier 2 and 3.
What is a good first-contact resolution rate?
Sixty-five to seventy-five per cent is realistic for a mature desk with a good knowledge base and proper Tier 1 authority. Below fifty per cent usually means Tier 1 cannot act rather than cannot diagnose. Above ninety per cent almost always means the metric is measured wrongly — typically by excluding escalations from the denominator.
How do we reduce ticket volume without making users unhappy?
Remove the tickets rather than deflecting them. Self-service password and account management, a software catalogue with automated fulfilment, zero-touch device enrolment, proactive outage notification, and problem management on anything recurring. All of these make the user experience better while reducing volume, which is why they are preferable to a chatbot that makes it harder to reach a person.
Do we need ITIL?
You need the practices, not the certification. Incident, problem, change, request and knowledge management as disciplines produce almost all of the benefit. A formal ITIL implementation is worth it where you have contractual or audit obligations that reference it, or a large internal team that needs a common vocabulary. Otherwise adopt the practices proportionately and skip the ceremony.
How should we measure satisfaction?
CSAT captured at ticket closure, with the response rate reported alongside — a ninety-five per cent score from four per cent of users is not evidence. Add a periodic survey for the experience as a whole, since transactional CSAT measures the last interaction rather than the service. Track both with trend; a single number without history cannot be acted on.
What should Tier 1 be allowed to do?
Everything that is standard, reversible and documented: password and account reset, standard access changes from an approved catalogue, software installation from the catalogue, re-imaging an endpoint, and known-error workarounds. What it should not do is production change, privileged access modification outside the catalogue, or anything without a documented procedure. The width of Tier 1 authority is the single biggest determinant of first-contact resolution.
Can AI replace Tier 1?
It can absorb a meaningful share of Tier 1 volume — password resets, status questions, categorisation, article retrieval — and it is genuinely useful for summarising threads and drafting responses for agent review. It should not close tickets autonomously or answer customer-facing questions without a retrieval layer grounded in your own knowledge base. The determinant of quality is the knowledge base, not the model.
How do we stop requests arriving outside the ticketing system?
Make the ticket route faster than the alternative, and make the alternative visible. If raising a ticket takes ten minutes and messaging an engineer takes ten seconds, the engineer will keep getting messages. A one-line capture route from chat or email, plus a policy that work without a ticket is not tracked and therefore not prioritised, changes behaviour within a quarter.
What happens to our ticket history if we change provider or tool?
Insist on a full export as a contractual deliverable, including ticket bodies, categorisation, timestamps, attachments and resolution notes. History is what makes trend analysis, problem management and cost comparison possible, and losing it resets your measurement baseline to zero. Confirm the export format before signature, not at exit.
What should we do first?
Measure the baseline: volume, mix by category, first response and resolution times, first-contact resolution, reopen rate, CSAT with response rate, and cost per ticket. Most organisations cannot produce three of those seven, and the ones they cannot produce are the ones that matter. The assessment produces all seven in two to four weeks and makes every subsequent decision evidence-based.
Book a Support Service Assessment
We will analyse twelve months of your ticket data, establish the seven baseline measures most organisations cannot produce, and show you where volume can be removed rather than absorbed. The category analysis alone usually identifies one or two automations that pay for the rest of the programme.
Contact Unified Management Consulting to arrange an initial assessment of your environment.
Related Services
Helpdesk and end-user support is the user-facing layer of our IT services:
- Computing, Server, Storage & Data Centre Engineering — the infrastructure Tier 2 and 3 escalate into
- Routing, Switching, Firewall & Network Engineering — connectivity faults and site support
- Cybersecurity Services & Solutions — where a ticket turns out to be a security event
- Cloud Services & Migration (AWS, Azure, GCP) — SaaS and identity platforms behind access requests
- DevOps & CI/CD Engineering Services — automation of provisioning and enrolment
- IT Staff Augmentation Services — covering peak or specialist demand without a full outsourcing commitment
- Data Engineering for AI: RAG & Knowledge Systems — the knowledge layer that determines whether AI assistance in support actually works
- Managed IT Infrastructure & IT AMC — 24×7 monitoring, patching, backup verification and monthly SLA reporting at a fixed cost
- Enterprise Systems Integration & Tech-Stack Consolidation — application inventory, integration architecture, decommissioning and measured savings
- IT Audit, Compliance & ISO 27001 / SOC 2 Readiness — Annex A gap analysis, control design, evidence automation and certification support
- Backup, Disaster Recovery & Business Continuity — business impact analysis, RTO and RPO tiering, immutable copies and tested runbooks
- Cloud Cost Optimisation & FinOps — tagging, allocation, showback, right-sizing, commitments and a monthly cadence
- Web Application Maintenance & Support — patching, monitoring, verified backups, defect management, committed change capacity and monthly service reporting