
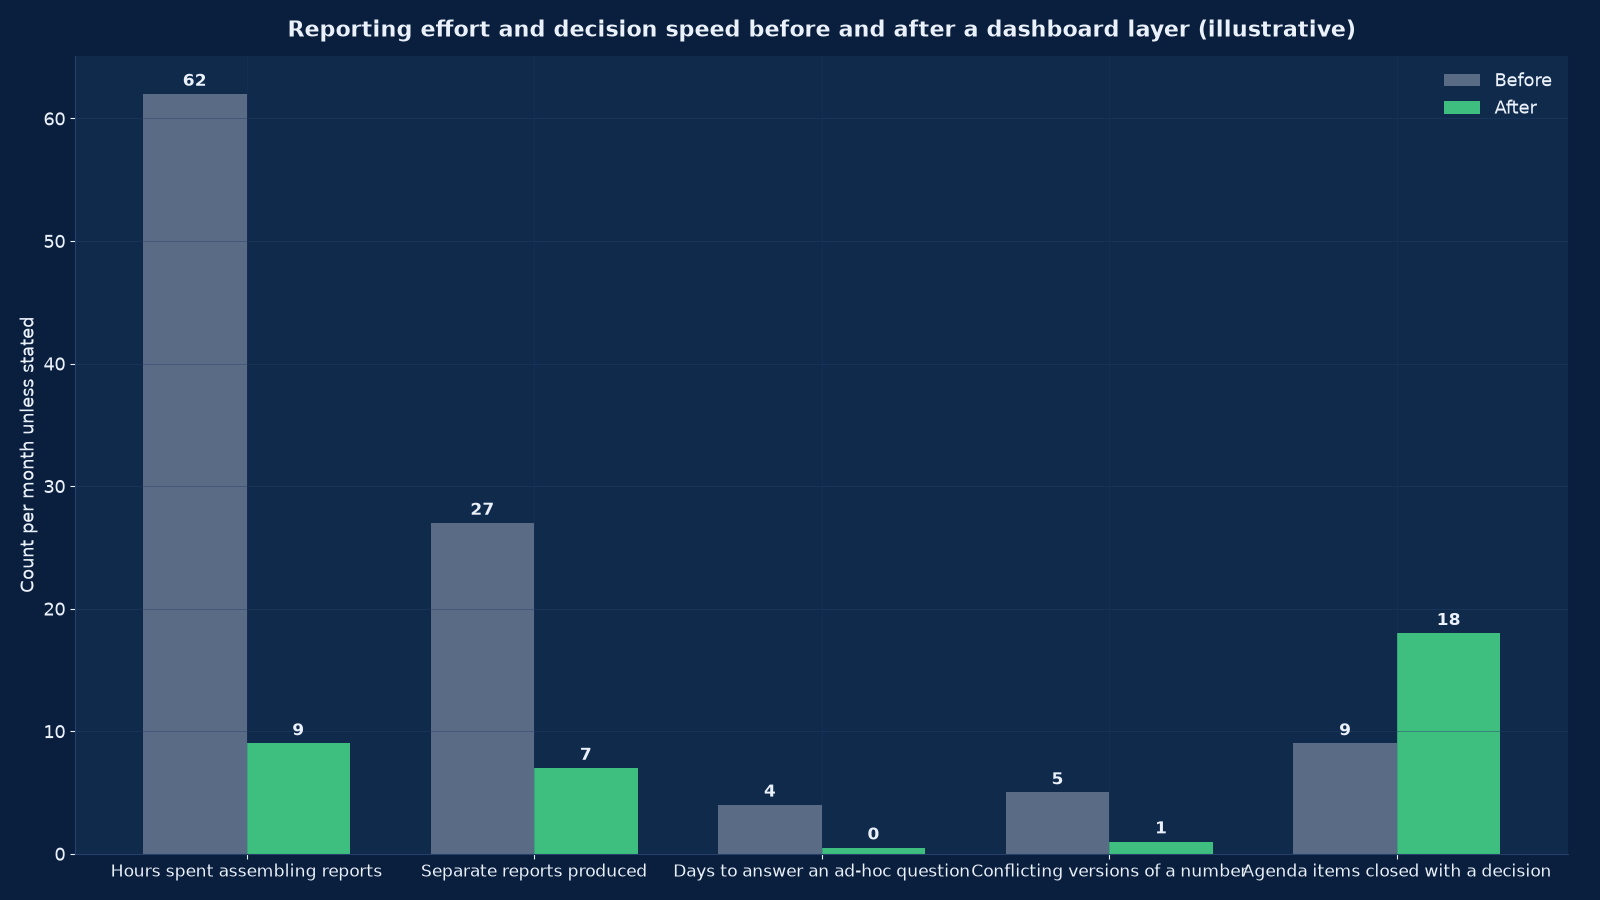
Chart values are an illustrative planning model based on typical UMC engagements and published industry benchmarks. They are not a guarantee of results on any specific project.
A dashboard is not a picture of your data. It is a decision surface — and if nobody changes what they do after looking at it, it is decoration.
BI dashboards and executive reporting turns the numbers your business already produces into a small set of agreed measures, defined once, refreshed automatically, and presented so that the people accountable for them can see performance and act in the same sitting. Unified Management Consulting designs and builds these layers on Power BI, Tableau, Looker or Looker Studio, starting from metric definitions rather than from whatever a tool makes easy to draw, and ending with the superseded spreadsheets actually withdrawn.
📊 BI Dashboards & Executive Reporting — Quick Summary
| Component | What We Deliver |
|---|---|
| Definition first | Every metric written down before it is charted: name, formula, grain, source system, owner, refresh frequency and known exclusions. |
| Semantic layer | One place where revenue, margin, customer and pipeline are defined, so a number means the same thing on every dashboard and in every pack. |
| Three tiers | An executive view, a function view and an operational view — each with a different grain, a different cadence and a different owner. |
| Platform agnostic | Power BI, Tableau, Looker and Looker Studio compared on your data, your licensing position and your team rather than on vendor claims. |
| Data quality gate | No dashboard is published over a source that has not been profiled, reconciled to the ledger and given a named owner. |
| Design for decisions | Page one carries the measures that trigger action; everything else is a drill-down, not a rival dashboard. |
| Access and security | Row-level security, role-based access, export controls and an audit trail suitable for a listed or lender-reviewed business. |
| Adoption, not delivery | Success is measured by reports retired, questions answered without a request, and decisions taken in the meeting — not by dashboards published. |
| Retirement discipline | Every superseded spreadsheet and scheduled report is withdrawn on a named date, or the old and the new run in parallel forever. |
This service is the reporting layer over the data platform described in our data warehouse and lakehouse service, and it is the delivery mechanism for the measures defined in Data Science Services for Business Analytics. Where the objective is proving value rather than reporting performance, AI ROI Measurement & Executive Scorecard Services applies the same discipline to investment cases.
Why Dashboard Programmes Fail
Very few dashboard projects fail technically. They fail because the organisation cannot agree what a number means, or because the dashboard was designed to display data rather than to support a decision. Both are fixable before any licence is bought.
| Failure mode | How it presents | What actually caused it |
|---|---|---|
| The dashboard nobody opens | Published with enthusiasm, accessed four times in the first week and never again | It was built from available data rather than from the questions the owner actually asks, so it answers nothing anybody needed |
| Five versions of revenue | Finance, sales, operations and the board pack each show a different number for the same month | No semantic layer: each report defines revenue locally, including or excluding different items |
| The 400-tab workbook survives | The dashboard exists but the management pack is still assembled by hand in Excel | The dashboard reproduces the report without replacing the process behind it |
| Refresh failure discovered late | A pipeline breaks on Tuesday and the team finds out on Friday from a wrong number | No monitoring, no data contract, no owner for the source |
| Everything is a KPI | Forty tiles on page one, all green, no action taken | No distinction between a measure that triggers a decision and a measure that merely informs |
| Permissions solved by sharing | A dashboard containing gross margin is emailed to the whole company | No row-level security design, so the workaround is a screenshot or an export |
| Built for the tool, not the business | Elegant visuals that cannot answer “which customer is unprofitable” | Selection started with a licence the business already had rather than with the decision |
| Abandoned at handover | The consultant leaves and nobody can change a measure | No documentation, no named internal owner, no change process |
The first two rows are the same defect seen from different angles: an undefined metric. Everything else in this section exists to prevent it, which is why the delivery programme in Figure 3 begins with definitions and data quality rather than with visuals.
The Three Tiers of a Reporting Layer
Most reporting problems are tier problems: an executive is shown operational detail, or a supervisor is given a monthly summary they cannot act on. Separating the three tiers is the single highest-value design decision in the programme.
| Tier | Audience | Grain and cadence | Content | Owner |
|---|---|---|---|---|
| Executive | Owner, CEO, board | Monthly and quarterly, with a weekly flash on cash and orders | Six to ten measures against plan and prior year, with variance and one-line commentary; a traffic-light exception list; no tables longer than ten rows | CEO or CFO |
| Function | Sales, operations, finance, marketing, HR leads | Weekly, occasionally daily | The function’s own measures decomposed by team, product, customer or region, with trend and drill-through to detail | Function head |
| Operational | Supervisors, controllers, team leads | Daily or intraday | Queue-level and transaction-level views designed to be worked from, not reviewed: ageing lists, exception queues, open items | Operational manager |
The tiers are not three dashboards. They are three views over one semantic layer, which is what keeps the executive number and the operational number consistent when someone drills from one to the other.
Metric Definitions and the Semantic Layer
Before any visual is designed, every metric that will appear anywhere is written down in a fixed format. This document is the deliverable that makes the rest possible, and it is what survives when a platform is later changed.
- Name and business definition. In plain language, without reference to a system — “revenue recognised on invoiced orders net of credit notes and discounts, excluding intercompany”.
- Formula and grain. The calculation, and the level at which it is valid: per invoice, per customer per month, per SKU per day. A metric without a stated grain will be aggregated incorrectly by someone eventually.
- Source and lineage. The system of record, the table or field, and the transformations applied between source and display.
- Owner. A named person accountable for the definition, who approves changes. Not a team.
- Exclusions and known gaps. What is deliberately left out and where the data is weak. Published exclusions prevent the argument; hidden ones guarantee it.
- Refresh frequency and latency. When it updates and how stale it can be before it is misleading.
- Target and comparator. Plan, prior year, prior period, benchmark — and which of these the audience is meant to react to.
The semantic layer is where these definitions are implemented once: calculated columns, measures, joins and hierarchies defined in the model rather than in each report. In Power BI this is the dataset with its DAX measures; in Looker it is the LookML model; in Tableau it is the published data source. The test of a proper semantic layer is simple: change the definition of gross margin in one place and every dashboard, pack and export updates.
Choosing the Platform
There is no best tool, only the best fit for your data estate, your licensing position and the people who will maintain it after go-live. This is the comparison we run against your actual sources, not against a vendor’s claims.
| Criterion | Power BI | Tableau | Looker | Looker Studio |
|---|---|---|---|---|
| Licensing economics | Per-user subscription; strong value where Microsoft 365 is already licensed | Per-user, creator and viewer split; premium features cost more | Platform and user pricing; usually the largest commitment of the four | Free; costs sit in the data source and in BigQuery usage |
| Modelling strength | Strong: DAX measures, relationships, row-level security in one dataset | Good visual modelling; semantics often live in the published data source | Strongest: LookML defines semantics in version-controlled code | Weak: relies on the underlying warehouse for semantics |
| Best fit | Microsoft estates, finance-heavy reporting, mid-market cost sensitivity | Analytical teams, complex visual exploration, mixed estates | Larger organisations wanting governed self-service across many teams | Marketing reporting, GA4 and Ads data, small teams, quick wins |
| Governed self-service | Good with certified datasets and endorsed content | Good with published sources and certified projects | Excellent — this is its design centre | Limited; sharing and duplication grow quickly |
| Row-level security | Native, role-based, well documented | Native via entitlements tables | Native and expressed in the model | Limited; usually handled upstream |
| Embedded and customer-facing | Possible with capacity licensing; check the terms | Strong embedding story | Strong embedding story | Not intended for it |
| Typical failure | A hundred personal datasets nobody governs | Beautiful workbooks that cannot be maintained by anyone but the author | LookML maintained by one person who then leaves | Fifty copies of the same report with slightly different numbers |
How we recommend deciding. List the sources you must connect today and the three you expect to add within two years; count the people who need to view and the people who need to build; establish what you already pay Microsoft or Google; then build the same executive view in two candidates using your real data and time it. A two-week pilot on your own numbers settles questions that months of evaluation will not. Our evaluation framework for analytics tooling sets out the same pilot-first approach for adjacent categories.
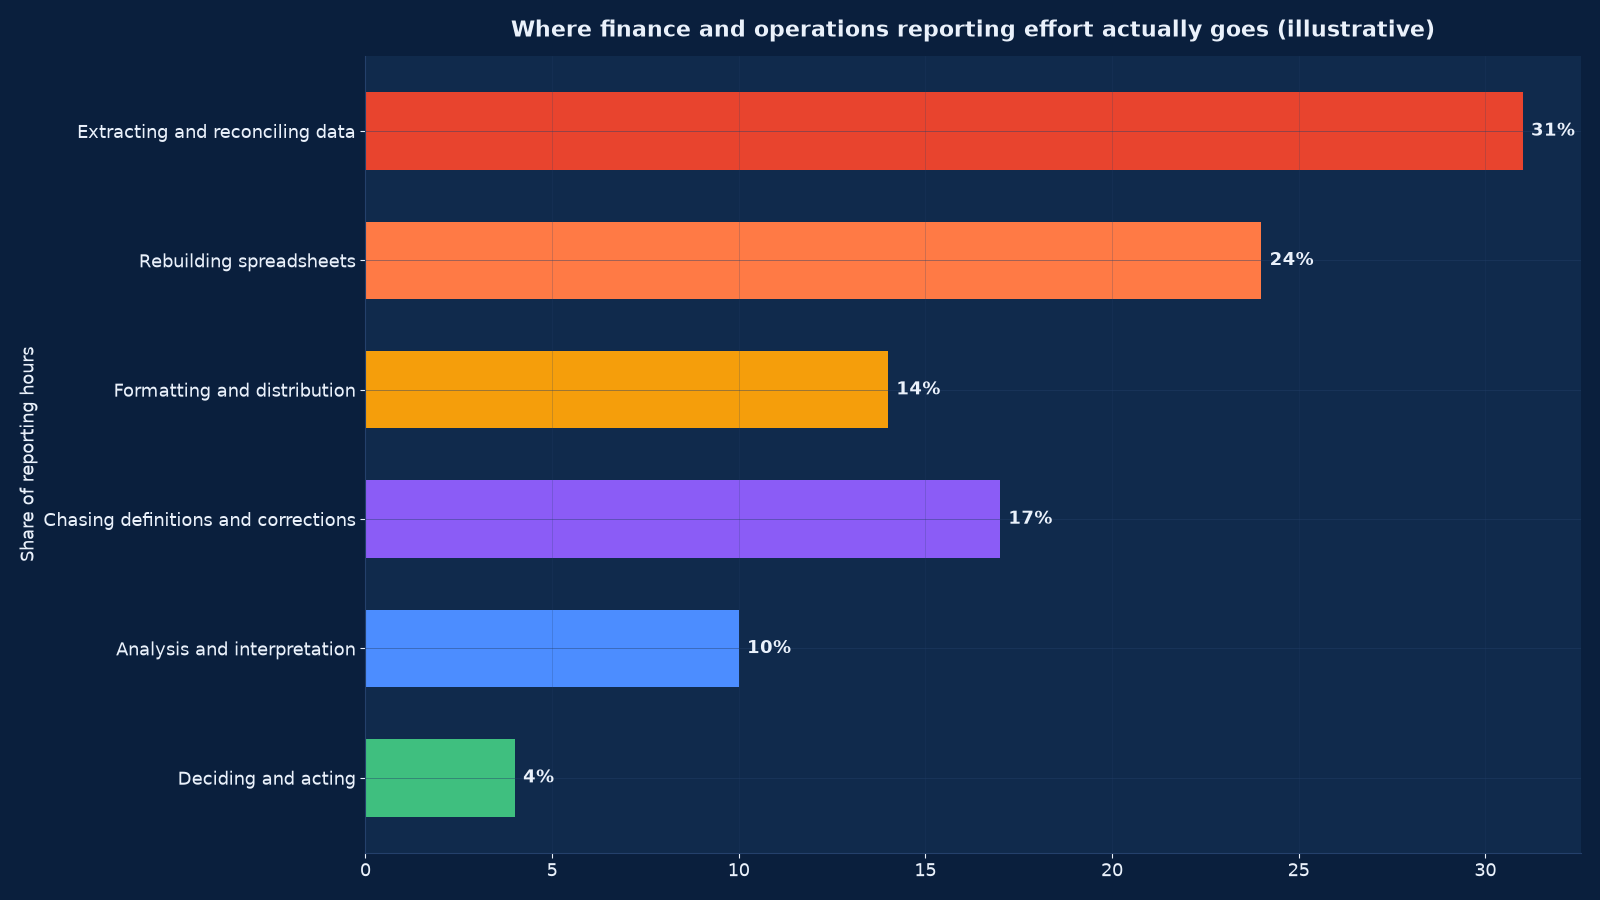
Chart values are an illustrative planning model based on typical UMC engagements and published industry benchmarks. They are not a guarantee of results on any specific project.
Designing the Executive Pack
The executive view is the one that determines whether the programme is judged a success, and it is the one most often over-built. Six to ten measures, a variance against plan and prior year, an exception list and a short commentary will outperform forty tiles every time.
| Audience | Page one must answer | Deliberately excluded |
|---|---|---|
| Owner or CEO | Are we on plan for revenue, margin and cash? What has changed since last month? What needs my decision this week? | Departmental detail, headcount lists, any table longer than ten rows |
| CFO and finance | Where is the variance, is it price / volume / mix / cost, and what is the forecast landing? | Marketing channel detail, operational queue metrics |
| Sales leadership | Is the pipeline covering the number, which deals are slipping, and where is the win rate moving? | Finance close detail, cost-to-serve by product |
| Operations leadership | Are we delivering on time and at cost, where is the constraint, and what is the quality trend? | Commercial margin debate, group cash position |
| Marketing leadership | Which channels are producing pipeline and revenue, at what cost, and what is changing? | Operational throughput, statutory reporting |
| Board or lender | Performance against plan and covenants, risk exposures, and the outlook with its assumptions | Anything that requires an internal system to interpret |
Layout rules we apply. The measure the audience reacts to goes top-left. Comparators sit next to the number, never on a separate page. Trend beats snapshot for anything that moves. Red is reserved for something that requires action, not for something merely below target. Every tile has a drill-through to the tier below. Nothing appears on page one that does not have a named owner who will be asked about it.
Data Quality: The Precondition Nobody Wants to Fund
A dashboard built over unreliable data is worse than no dashboard, because it lends authority to a wrong number. Before publication, every source feeding a page-one measure passes four gates.
- Reconciliation. The measure ties to the ledger or to the system of record for at least three closed periods, with the difference explained and documented rather than rounded away.
- Completeness. Null rates, missing periods and duplicate keys are measured, not assumed. Where a source is incomplete, the dashboard says so on its face.
- Currency. Refresh latency is known and displayed. A dashboard showing yesterday’s data labelled “live” will be distrusted the first time somebody checks.
- Ownership. Each source has a named business owner who accepts the data contract — the fields, the definitions and the notice period for changes.
In practice this step finds the real problems: revenue recognised differently in the CRM and the ledger, customer records duplicated across two systems, product codes reused after a migration, and a payroll export that has been manually adjusted for eleven months. Fixing them is often most of the programme’s value, and it is why the ten-week plan in Figure 3 runs data quality in parallel with definitions rather than after the build. Our CRM data migration guide describes the cleansing and mapping discipline this step borrows.
Governance, Access and Security
Dashboards concentrate sensitive information in one place, which makes them a governance object rather than a report. Five controls are standard on every engagement.
Row-level security. A regional manager sees their region; a franchisee sees their unit; the board sees the group. Implemented in the model, not by publishing separate reports — separate reports always drift.
Role-based access with review. Access is granted by role, reviewed quarterly, and removed by the joiner-mover-leaver process rather than by memory. Export permissions are a separate decision from view permissions, because an export defeats every other control.
Certified versus personal content. Endorsed datasets and certified reports are marked as such and owned; personal workspaces are allowed but never quoted in a management meeting. Without this distinction the estate grows into hundreds of unowned reports.
Audit trail. Who viewed, who exported, when the model changed and who approved the change. For listed entities, lender reporting and regulated sectors this is not optional.
Change control on definitions. A metric definition changes only with its owner’s approval, is version-dated, and is announced to the audience — because a silent definition change destroys trust faster than an outage does. AI Governance, Risk & Compliance applies the same control framework where the reporting layer feeds models rather than people, and IT Audit, Compliance & ISO 27001 / SOC 2 Readiness is where the evidence pack for these controls is assembled.
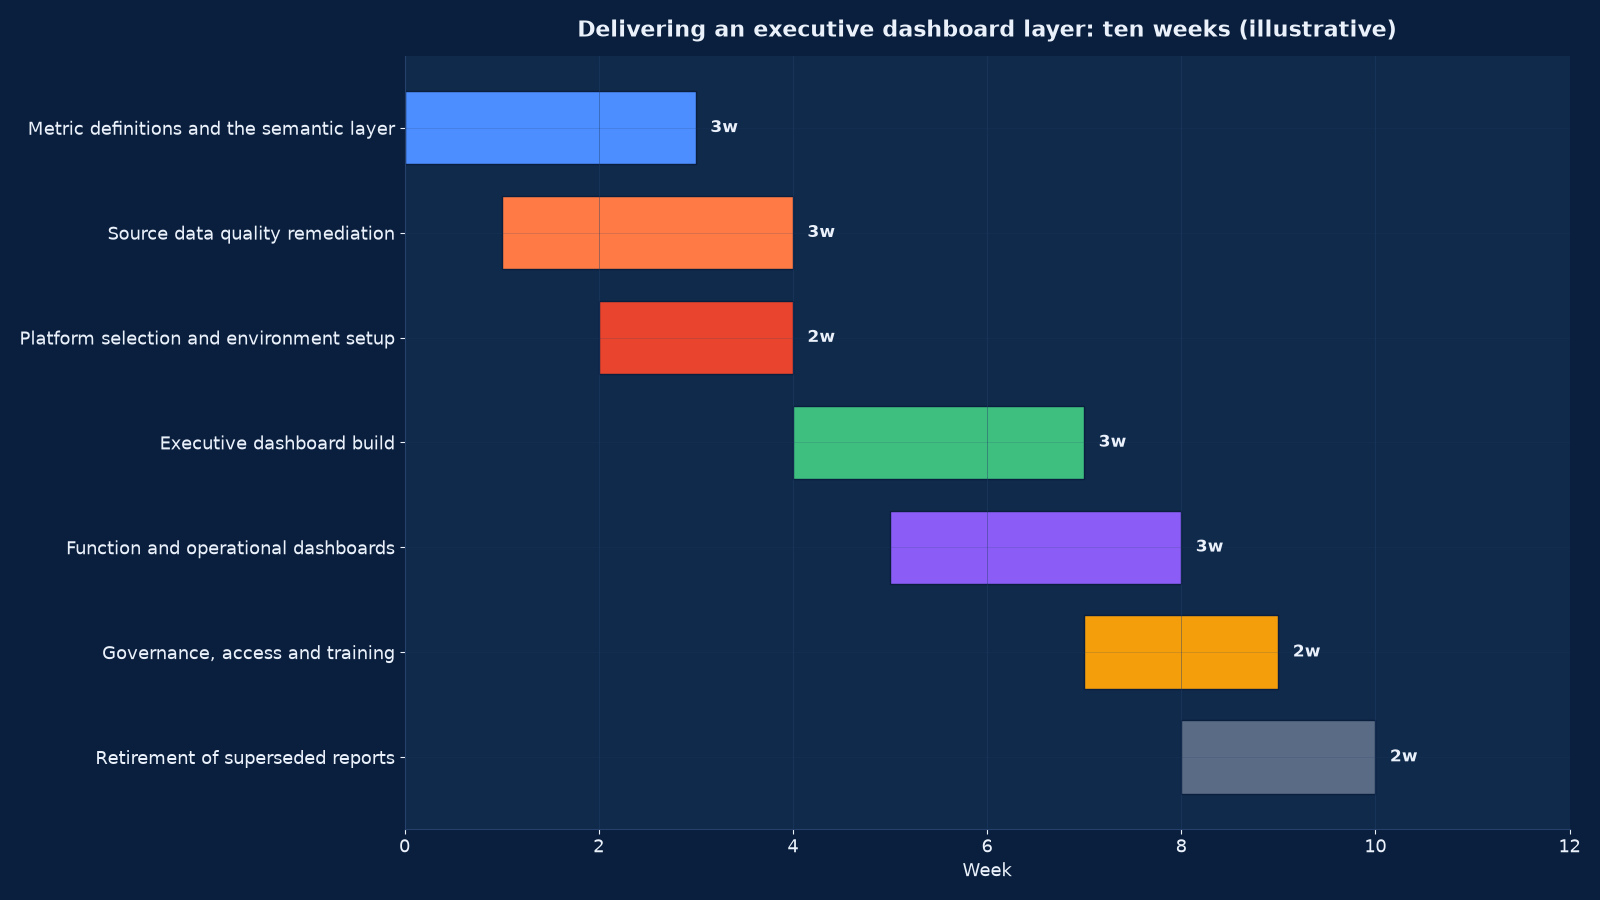
Chart values are an illustrative planning model based on typical UMC engagements and published industry benchmarks. They are not a guarantee of results on any specific project.
The Ten-Week Delivery Programme
| Phase | Weeks | Activities | Output |
|---|---|---|---|
| Discovery and metric definitions | 1–3 | Interviews with each tier’s audience, inventory of existing reports, drafting of the metric dictionary with owners | A metric dictionary signed off by measure owners |
| Data quality remediation | 2–4 | Source profiling, reconciliation to the ledger, duplicate and null treatment, data contracts agreed | A reconciliation report and named source owners |
| Platform and environment | 3–4 | Licensing decision, workspace design, connection and gateway setup, deployment pipeline | A working development, test and production environment |
| Semantic layer build | 4–6 | Model, relationships, calculated measures, hierarchies, row-level security rules | One governed dataset implementing every definition |
| Executive and function dashboards | 5–8 | Page-one design, drill-throughs, variance and commentary mechanics, review cycles with each audience | Published tiers one and two |
| Operational views | 6–8 | Queue and exception views designed to be worked from | Published tier three |
| Governance and training | 8–9 | Access model live, certification rules published, owner and viewer training | A governance document and trained owners |
| Report retirement | 9–10 | Superseded spreadsheets and scheduled reports withdrawn on a named date | A retirement list with dates, and the effort baseline re-measured |
Measuring Whether It Worked
Adoption and effort are measured, not assumed. The baseline is taken in week one so that the improvement is a comparison rather than a claim.
| Measure | Definition | Baseline and target |
|---|---|---|
| Hours per month assembling reports | Finance, sales and operations effort counted across the team | Baselined in week one; typically falls by two thirds |
| Separate reports in circulation | Count of recurring reports and scheduled exports | Baselined in week one; target is a reduction of half or more |
| Conflicting definitions of a core metric | Number of distinct calculations of revenue, margin or pipeline in active use | Target: one |
| Time to answer an ad-hoc question | Median hours from request to answer | Days to hours for questions the model covers |
| Days to close the month | Working days from period end to signed pack | Falls as reconciliation becomes automatic |
| Active users by tier | Distinct users opening the relevant tier each week | Above 80% of the intended audience by week eight |
| Decisions recorded against a dashboard | Entries in the decision log referencing a measure | Rising — the measure that actually matters |
| Refresh failures detected before users | Share of failures caught by monitoring | Above 95% |
| Reports retired | Count withdrawn on schedule | All superseded reports by week ten |
The seventh row is the one we report to the owner. If the leadership team is not referring to the dashboard when it takes decisions, the programme has produced a nicer way of looking at the same numbers, and the cause is almost always in the metric dictionary rather than in the visuals.
Running This in an Indian Mid-Market Business
Several conditions recur in Indian mid-market and family-owned businesses, and each changes the programme’s emphasis.
Two books of performance. A statutory view for filings and a management view for decisions, often maintained separately and rarely reconciled. The dashboard must be built on the management view with an explicit, documented bridge to the statutory one — GST returns, TDS and TCS, MCA and ROC filings all carry dates and consequences that belong on the compliance page of the executive view.
ERP plus spreadsheets. Tally, Busy, SAP Business One, Oracle NetSuite or a sector-specific ERP, with the real reporting done in Excel on top. The programme’s value often comes from removing the spreadsheet layer rather than from replacing the ERP — and from making the manual adjustments inside it explicit.
Group structures and related parties. Intercompany sales, shared services and related-party pricing mean that consolidated revenue is not the sum of entity revenue. Eliminations belong in the semantic layer where they are defined once, not in a monthly manual adjustment.
Owner-led decision culture. Reporting often exists to inform one person. The three-tier model is what allows delegation: the owner keeps the executive tier, function heads get the second tier with real authority, and the operational tier is where the daily work happens. Unified Top-Level Business Management & Handling describes the decision-rights work this reporting layer depends on.
Lender and investor reporting. Where a business has term loans, working capital limits or institutional investors, a fixed monthly or quarterly pack is usually already contractually required. Building the dashboard so that pack is generated rather than assembled is frequently the fastest route to a return, and Cash Flow & Working Capital Recovery is where that reporting obligation and the thirteen-week forecast meet.
After Go-Live: The Operating Model
Most dashboard layers decay within a year of handover for want of an operating model rather than for want of skill. Six commitments keep it alive.
- A named internal owner for the semantic layer, with authority to approve definition changes.
- A change process with a backlog, a release cadence and version-dated release notes to the audience.
- Monitoring on refresh success, row counts, latency and reconciliation differences, alerting to a person rather than to a group.
- Quarterly access review tied to the joiner-mover-leaver process.
- An annual definition review — the business changes, and a metric dictionary that has not been revisited in two years is describing a different company.
- Cost control on licences and on the warehouse compute behind them, which is where Cloud Cost Optimisation & FinOps applies directly: an ungoverned semantic layer querying a warehouse on a schedule is a common and entirely avoidable source of cloud spend.
Where the source systems themselves need consolidating before any of this is possible, Enterprise Systems Integration & Tech-Stack Consolidation is the prior step, and Data Science Services for Business Analytics is what you build on top once the reporting layer is stable.
Engagement Models
| Model | Duration | Deliverables | Best when |
|---|---|---|---|
| Reporting diagnostic | 2–3 weeks | Inventory of every report in circulation, effort baseline, metric conflict list, platform recommendation | You suspect the reporting layer is the problem but cannot evidence it |
| Metric dictionary and semantic layer | 3–5 weeks | Signed-off definitions with owners, implemented in a governed model | Different functions produce different numbers for the same thing |
| Full dashboard layer | 10 weeks | All three tiers published, governance live, superseded reports retired | The standard engagement |
| Executive pack only | 4–6 weeks | The board or owner view with variance, commentary mechanics and drill-through | The leadership meeting is the bottleneck |
| Platform migration | 8–14 weeks | Rebuild from one BI platform to another with parallel running and reconciliation | Licensing, capability or scale has outgrown the current tool |
| Managed reporting service | Monthly | Ownership of refresh monitoring, definition changes, access reviews and the quarterly pack | You want the capability without the internal headcount |
What Good Looks Like After Ten Weeks
The programme has worked when reporting stops being an activity and becomes infrastructure.
- One metric dictionary exists, with a named owner per measure, and it is the reference used in management meetings.
- The executive tier answers its six to ten questions on page one, with variance and commentary, and it is what the meeting actually looks at.
- Function and operational tiers exist at the right grain, so a supervisor works from a queue rather than from a summary.
- Every page-one measure reconciles to the ledger or system of record, and the exceptions are documented.
- Row-level security is in the model, access is role-based, and exports are controlled.
- Refresh failures alert a person before a user sees a wrong number.
- The superseded spreadsheets have been withdrawn on a named date and the effort baseline has been re-measured.
- Somebody inside the business can add a measure without calling us.
Two follow-ons usually apply. Where the constraint turned out to be the sources rather than the reporting, the data warehouse build is the next engagement. Where the leadership layer could not say what it needed to see, the 30-Day Turnaround Diagnostic establishes the position first and defines the measures the dashboard should carry — and our piece on how CEOs balance immediate pressure with long-term opportunity explains why the executive tier usually needs both a flash view and a trend view to serve that tension.
Frequently Asked Questions About BI Dashboards & Executive Reporting
Which platform should we choose?
The one that fits your data estate, your existing licensing and the people who will maintain it. For a Microsoft-heavy mid-market business, Power BI is usually the most economical and its DAX modelling is strong. Tableau suits analytical teams doing exploratory work. Looker is the right answer where governed self-service across many teams is the objective and the commitment is affordable. Looker Studio is genuinely useful for marketing reporting over GA4 and Ads data at low cost. We will build the same executive view in two candidates on your real data and time it rather than recommend from a feature matrix.
How long does it take?
Ten weeks for the full three-tier layer, four to six for an executive pack alone, and two to three for a diagnostic that tells you whether you need either. The variable is never the visuals; it is how far your source data is from being reconcilable. Where the ledger and the CRM disagree about revenue, expect the first three weeks to be spent on that rather than on dashboards.
Do we need a data warehouse first?
Not always. If you have two or three sources, a clean ERP export and a small team, a governed dataset in the BI platform is enough and a warehouse is premature spend. If you have many sources, history you must retain, or several teams needing the same definitions, the warehouse comes first — otherwise you will build the same transformations several times and they will diverge.
Why do our dashboards stop being used?
Almost always because they were built from available data rather than from the questions the audience asks, so they inform without helping anyone decide. The second cause is definition conflict: once a manager discovers the dashboard’s revenue does not match the pack they were given, they go back to their own spreadsheet and never return. Both are prevented by the metric dictionary, which is why it comes first.
How many measures should an executive dashboard have?
Six to ten on page one. Enough to cover revenue, margin, cash, delivery, pipeline and people without becoming a table of contents. Each needs a comparator (plan, prior year or prior period), a trend, and a named owner who will be asked about it. Everything else belongs on a drill-through page or in a function tier.
Can we keep using Excel?
Yes, and you should for analysis and for ad-hoc modelling — that is what it is good at. What you should stop doing is assembling the recurring pack by hand in Excel. The test of a successful programme is that the workbook becomes an analytical tool used by choice rather than a reporting mechanism used from necessity, and that the scheduled reports it replaced are actually withdrawn.
How do you handle sensitive data such as margins and salaries?
With row-level security implemented in the model, so one report serves every audience and each user sees only the rows they are entitled to. Role-based access reviewed quarterly, export permissions decided separately from view permissions, and an audit trail of views, exports and model changes. Screenshot culture is a symptom of missing security, not of user misconduct.
What if our data quality is poor?
Then that is the project. We profile the sources, reconcile what can be reconciled, document what cannot, and publish the dashboard with its gaps stated on its face rather than hidden behind a confident-looking chart. A measure labelled as estimated with a known error range is trusted; the same measure presented as exact and later found wrong is not.
Do you build it or do we?
Usually both. We build the semantic layer, the executive tier and the governance, and we train a named internal owner to build the function and operational tiers. A layer that only a consultant can change is a liability, so the handover includes documentation, a deployment pipeline and a change process — and the last week of the programme is spent on retirement and training rather than on new visuals.
How does this relate to your data science service?
This service produces the defined, governed, reliable numbers; data science produces the models that use them. Running predictive work before the reporting layer is stable is the most common cause of a model that cannot be trusted in production, because the features inherit the same definitional ambiguity the dashboards would have exposed.
What should we do first?
Inventory every recurring report in circulation, count the hours spent producing them, and list the metrics where two functions produce different numbers. That exercise takes two to three weeks, costs little, and tells you whether you need a dashboard layer, a semantic layer, a warehouse, or only the discipline to retire thirty reports.
Start With the Metric Dictionary
Tell us what your leadership meeting currently looks at, how long the pack takes to produce, and where two functions disagree about a number. We will scope the diagnostic, recommend the platform against your actual estate rather than a feature list, and give you a fixed-price ten-week plan with the retirement of your existing reports built into it.
Contact Unified Management Consulting to arrange a confidential first conversation.
Related Services
BI dashboards and executive reporting is delivered alongside our other data and consulting services:
- Data Science Services for Business Analytics — the analytical capability that sits on top of a governed reporting layer
- Custom CRM Development & Integration Services — the system of record for the pipeline measures
- Analytics & Attribution Services (GA4) — the web and campaign data source behind marketing tiers
- Enterprise Systems Integration & Tech-Stack Consolidation — consolidating the sources before the reporting is built
- Cloud Cost Optimisation & FinOps — controlling the warehouse and licence cost the layer runs on
- Unified Top-Level Business Management & Handling — the decision rights and cadence the reporting layer serves
- AI ROI Measurement & Executive Scorecard Services — the same reporting discipline applied to investment cases
- Data Warehouse & Lakehouse Build — source profiling, bronze-silver-gold layers, conformed dimensions, quality tests, lineage and cost engineering
- Marketing Mix Modelling & Attribution — how much revenue each channel actually causes, with response curves validated against holdout tests
- Sales Analytics & Pipeline Intelligence — stage definitions, CRM hygiene, deal risk signals, three-way forecasting and a routed exception queue
- Predictive Analytics & Demand Forecasting — use case selection, naive baselines, walk-forward validation, prediction intervals and model operations