
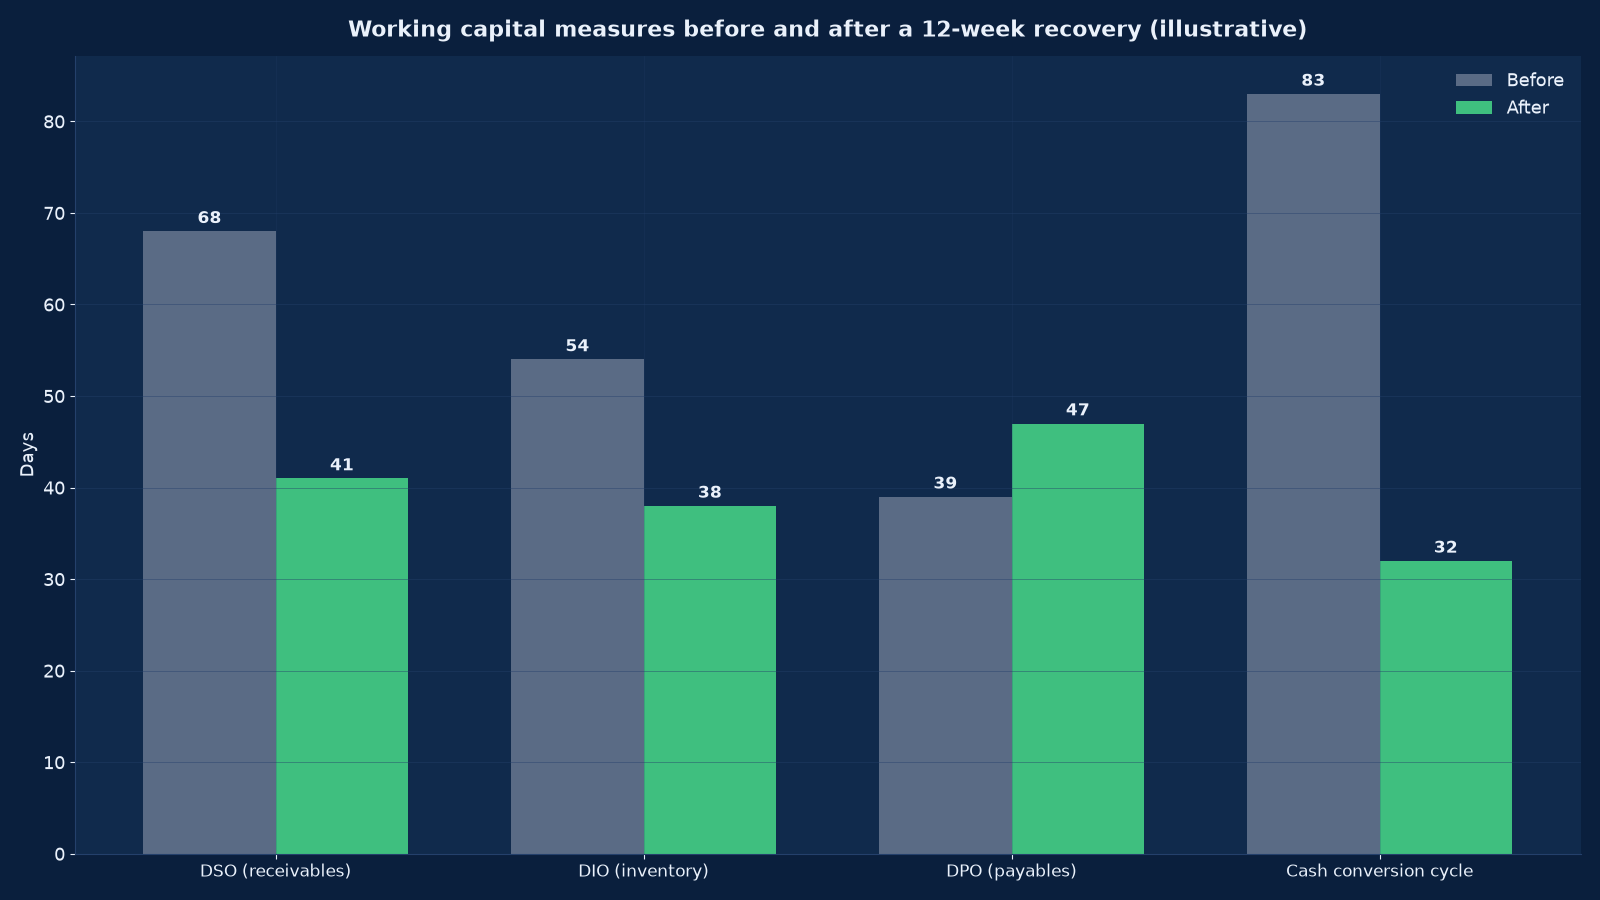
Chart values are an illustrative planning model based on typical UMC engagements and published industry benchmarks. They are not a guarantee of results on any specific project.
Profit is an opinion until the cash arrives. A business can be profitable on every measure the accounts use and still fail on a Tuesday, because a profitable sale that pays in 120 days consumes cash today and returns it four months later.
Cash flow and working capital recovery is the discipline of getting cash out of the business you already have: collecting what is owed, holding less stock, paying on terms you negotiated rather than terms you accepted, forecasting thirteen weeks ahead accurately, and making cash a weekly management subject instead of a monthly surprise. Unified Management Consulting runs this as a twelve-week programme with a named owner per lever, a forecast the finance team maintains afterwards, and savings measured in cash released rather than in percentage improvements.
💰 Cash Flow & Working Capital Recovery — Quick Summary
| Component | What We Deliver |
|---|---|
| 13-week cash forecast | Built from ledgers and bank statements rather than budgets, with base and downside cases, assumptions stated separately, and updated weekly by your team. |
| Daily cash control | A single view of balances, expected receipts and scheduled payments, with a payment release process during stress so nothing leaves without a decision. |
| Receivables recovery | Ageing-based collection process, dispute resolution, credit control discipline, payment terms enforcement and, where justified, escalation. |
| Working capital levers | DSO, DIO and DPO each with a target, an owner and a plan — plus unbilled revenue and unclaimed credits, which are usually the fastest cash available. |
| Inventory rationalisation | Coverage by line, slow-moving and obsolete stock, reorder discipline, and supplier lead-time changes that reduce the need to hold. |
| Payables and supplier terms | Terms renegotiated rather than stretched, payment scheduling that protects critical suppliers, and the statutory dues kept current. |
| Covenant and lender management | Headroom tracked, breaches anticipated rather than discovered, and a credible position presented before the bank asks for one. |
| Financing structuring | Where cash need is structural: the right instrument for the right asset, costed honestly including arrangement fees and personal guarantees. |
| Cash cadence and handover | A weekly cash meeting with a standing agenda, and a forecast your finance team can run without us. |
This service follows naturally from the 30-Day Turnaround Diagnostic in this category, pairs with cost rationalisation and margin recovery where the problem is profitability as well as timing, and complements Risk, Governance & Business Continuity Support for businesses that want cash discipline before it becomes urgent. Our bank credit facility project summary shows how much of a successful financing conversation is cash discipline rather than negotiation.
Why Profitable Businesses Run Out of Cash
Every cash crisis we are called into has one of these eight causes, and usually two or three compounding. None of them is visible in the profit and loss account.
| Cause | Mechanism | Early warning |
|---|---|---|
| Growth | Each new order consumes working capital before it returns any; a growing business can outgrow its own cash | Revenue rising while the bank balance falls; the overdraft permanently at its limit |
| Payment behaviour drift | Terms are agreed at 30 days and collected at 90 because nobody challenges it | DSO rising month on month with no change in customer mix |
| Disputes and billing delays | Work delivered but not invoiced, or invoiced and disputed, so the cash never enters the ageing | Unbilled revenue growing; a rising share of invoices queried |
| Inventory held for comfort | Stock ordered against forecasts that are wrong, and never cleared | Inventory days rising faster than sales; growing obsolete-stock provisions |
| Margin erosion | Input costs rise and are not passed through, so each sale returns less cash than it consumes | Contribution falling while volume holds |
| Capex funded from working capital | Long-lived assets bought with short-term facilities | Facility utilisation rising without a rise in receivables or stock |
| Seasonality unplanned | A known trough treated each year as a surprise | The same cash crisis in the same month, annually |
| One large customer | Concentration means one payer’s behaviour is the business’s cash position | A single debtor representing a material share of receipts |
The first is the most counter-intuitive and the most common in growing businesses. Growth consumes cash at the point of sale and returns it at the point of collection, so the faster you grow, the more funding you need — and a business growing at thirty per cent with ninety-day collections needs substantially more working capital than the same business growing at ten per cent. Our piece on how CEOs balance immediate pressure with long-term opportunity describes exactly this tension from the leadership side.
The 13-Week Cash Forecast
Thirteen weeks is the standard horizon because it is long enough to see a funding requirement coming and short enough to be built from actual ledgers rather than from assumptions about the future.
| Forecast line | Source | Assumption discipline |
|---|---|---|
| Opening bank position | Bank statements and reconciliations, not the ledger balance | Reconciled to the bank on day one |
| Customer receipts | Debtor ageing by band, with historical collection behaviour per customer | Collection rates by band, not by invoice terms — the two are usually different |
| Unbilled and unclaimed | Work-in-progress records, unraised invoices, credit notes due | Conservative recognition dates; this is often the fastest cash in the plan |
| Payroll and statutory | Payroll calendar, GST, TDS, PF, ESI, professional tax dates | Fixed dates; never deferred in the base case |
| Supplier payments | Creditor ageing with terms, plus committed orders | Critical suppliers paid per terms; others scheduled deliberately |
| Debt service and facilities | Loan schedules, interest dates, facility fees | Per documentation, including any covenant-driven repayment |
| Capex and committed spend | Approved projects and contractual commitments | Separated into cancellable and committed |
| Tax and one-off items | Advance tax, self-assessment, disputes, refunds expected | Refunds excluded from the base case until received |
Two disciplines make it useful. Assumptions are written separately from numbers so they can be challenged without rebuilding the model. Variance is reviewed weekly — actual against forecast for the week just passed, with the reason. After eight weeks the forecast is either accurate or the business has learned precisely where it cannot predict itself, and both outcomes are valuable.
Receivables: Where Most of the Cash Is
Debtor days are the largest and fastest lever in most businesses, because the money is already owed. The work is process, not pressure.
| Ageing band | What it usually means | Action |
|---|---|---|
| Current (not yet due) | Normal | Confirm terms are on the invoice and the invoice is correct |
| 1–30 days overdue | Process friction: unlogged queries, wrong contact, approval delay | Call rather than email; resolve the query; confirm a payment date in writing |
| 31–60 days | Behavioural: the customer pays whoever asks | Escalate to the account owner; hold further credit or delivery until a date is agreed |
| 61–90 days | Disputed or deliberate | Formal statement, senior-to-senior contact, and a decision on whether to keep the customer |
| Over 90 days | Effectively a financing decision you are making for free | Legal notice or collection agency; provide for it; change terms or stop supplying |
| Disputed invoices | Often a delivery or documentation failure, not a payment failure | Resolve within five days; measure dispute rate as a quality indicator |
Three changes deliver most of the improvement. Invoicing at the point of delivery rather than in a monthly batch — every day of delay in raising an invoice is a day of delay in collection. A named owner per debtor, because “the finance team collects” means nobody collects. A weekly debtor meeting during recovery, reviewing the top twenty accounts by value with a committed date against each. Where disputes are a large share of the ageing, the problem is upstream in delivery or documentation, and fixing that is worth more than any collection effort.
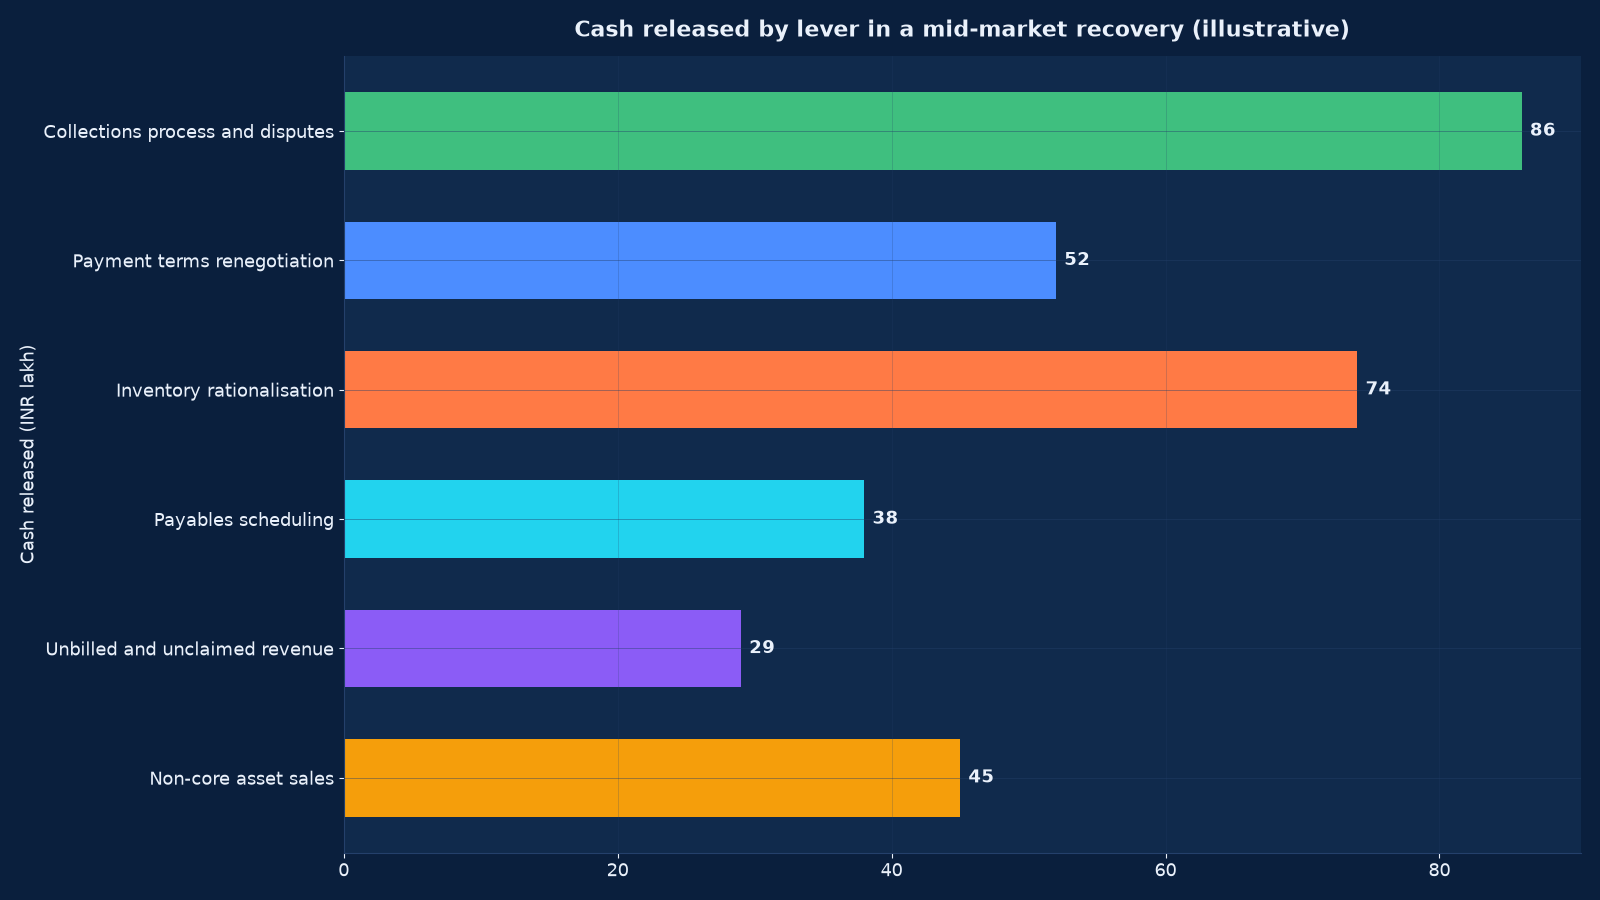
Chart values are an illustrative planning model based on typical UMC engagements and published industry benchmarks. They are not a guarantee of results on any specific project.
The Working Capital Levers, Ranked by Cash Effect
| Lever | Typical cash effect | Speed | Risk to manage |
|---|---|---|---|
| Collections process and dispute resolution | Largest single release; reduces DSO by 15–30 days | 4–8 weeks | Over-aggressive collection damaging a good customer relationship |
| Inventory rationalisation | Second largest; reduces DIO by 10–20 days | 6–12 weeks | Stock-outs on fast movers; write-offs are a P&L event, not a cash one |
| Payment terms renegotiation | Moderate; moves DPO out 5–15 days where suppliers agree | 4–10 weeks | Suppliers raising prices or tightening credit in response |
| Unbilled revenue and unclaimed credits | Small but immediate; often 2–5% of annual revenue | 1–3 weeks | None — this is money already earned |
| Payables scheduling | Moderate and temporary; protects the trough | Immediate | Stretching the wrong supplier stops delivery |
| Customer deposits and stage payments | Structural improvement where the contract allows | One contract cycle | Competitive position; not available in tendered work |
| Non-core asset sales | Lumpy but real; also removes running cost | 4–16 weeks | Selling an asset the business will need to lease back |
| Cost reduction | Durable but slow, and only partly cash within thirteen weeks | 8–16 weeks | Cutting the capacity needed to deliver the recovery |
Inventory and Procurement
Holding stock is a financing decision disguised as an operational habit. The review is straightforward and the findings are usually concentrated.
- Coverage by line, not in total. Total inventory value tells you nothing; weeks of cover per line tells you which twenty lines hold most of the cash.
- Slow-moving and obsolete stock. Anything not moved in twelve months is a decision: discount it, return it, use it, or write it off and stop paying to store it.
- Reorder discipline. Minimum order quantities and reorder points set years ago against different volumes are quietly over-ordering every week.
- Lead time versus holding. A supplier lead time reduced from eight weeks to three removes more cash than any stock count, because it removes the reason for holding.
- Consignment and vendor-managed stock. Where available, they move the financing to the supplier in exchange for commitment — a trade worth pricing explicitly.
- Purchase price versus total cost. A two per cent price saving that requires a doubling of order size is a working capital decision, not a procurement saving.
Procurement concentration often releases cash and cost at the same time: five suppliers in one category become two, with better terms because the volume is worth negotiating for. The same logic applied to technology spend is covered in our cloud cost and FinOps service.
Payables: Negotiate, Do Not Simply Stretch
There is a difference between agreeing longer terms and paying late without agreement. The first improves cash sustainably; the second buys a fortnight and costs you supply.
Ask for terms. Suppliers frequently extend payment periods when asked directly by a credible buyer with a plan, especially in exchange for volume consolidation or a longer contract. This is a commercial conversation, not a default.
Protect the critical few. Rank suppliers by what happens if they stop delivering. The single-source provider of a production input gets paid on time even when others wait; a business that loses its supply line to save fifteen days of cash has made a bad trade.
Keep statutory dues current. GST, TDS, PF, ESI and professional tax are not discretionary payables. Arrears attract interest and penalties, create personal exposure for directors in some cases, and are among the first things a lender or buyer examines. They are scheduled as fixed dates in the forecast and never deferred in the base case.
Respect the MSME payment rules. Where your suppliers are micro, small or medium enterprises, Indian law requires payment within forty-five days of acceptance, and delayed payments can be reported and carry disallowance consequences for tax purposes. This is not a lever to pull; it is a constraint to plan around, and a business that has been stretching MSME suppliers has a compliance exposure as well as a cash one.
Document everything. An agreed payment plan with a supplier, in writing, is worth far more than an unacknowledged delay — it preserves the relationship and it is evidence of management if a lender reviews the position.
Covenants, Lenders and Financing
Manage the lender before the lender manages you. A borrower who presents a thirteen-week forecast, a named plan and a realistic ask is treated completely differently from one who explains a breach after it happens.
| Instrument | Best for | Typical cost driver | Watch out for |
|---|---|---|---|
| Overdraft or cash credit | Short-term timing gaps against receivables | Interest on utilisation plus commitment charges | Being permanently at the limit is a structural problem presented as a facility |
| Working capital demand loan | A defined seasonal trough | Interest for a fixed tenure | Renewal risk if the trough becomes permanent |
| Invoice discounting or factoring | Businesses with concentrated, creditworthy debtors | Discount charge plus service fee | Recourse provisions, and the effect on customer relationships if notified |
| Bill discounting | Documented trade receivables with clear acceptance | Discount rate per bill | Documentation quality; disputes undo the facility |
| Supply chain or vendor financing | Large buyers extending terms while suppliers get paid early | Arranged fee, often shared | Dependency on the anchor buyer’s programme continuing |
| Term loan for equipment | Long-lived assets | Interest over the asset life | Matching tenure to asset life — never fund equipment from working capital |
| Lease or hire purchase | Assets with a residual value or fast obsolescence | Lease rentals | Total cost over the term versus outright purchase |
| Equity or quasi-equity | A structural funding gap or a growth plan | Dilution | Raising equity to fix a working capital process problem is expensive permanence |
Two practices matter. Track headroom monthly against every covenant — not only at the testing date, because the fix for a projected breach has to start months before it occurs. Never fund a long-lived asset from a short-term facility. This single mismatch causes a large share of the funding crises we see: the asset generates returns over seven years while the facility must be repaid or renewed in one. Our banking and credit-products project summary describes the lender side of that conversation.
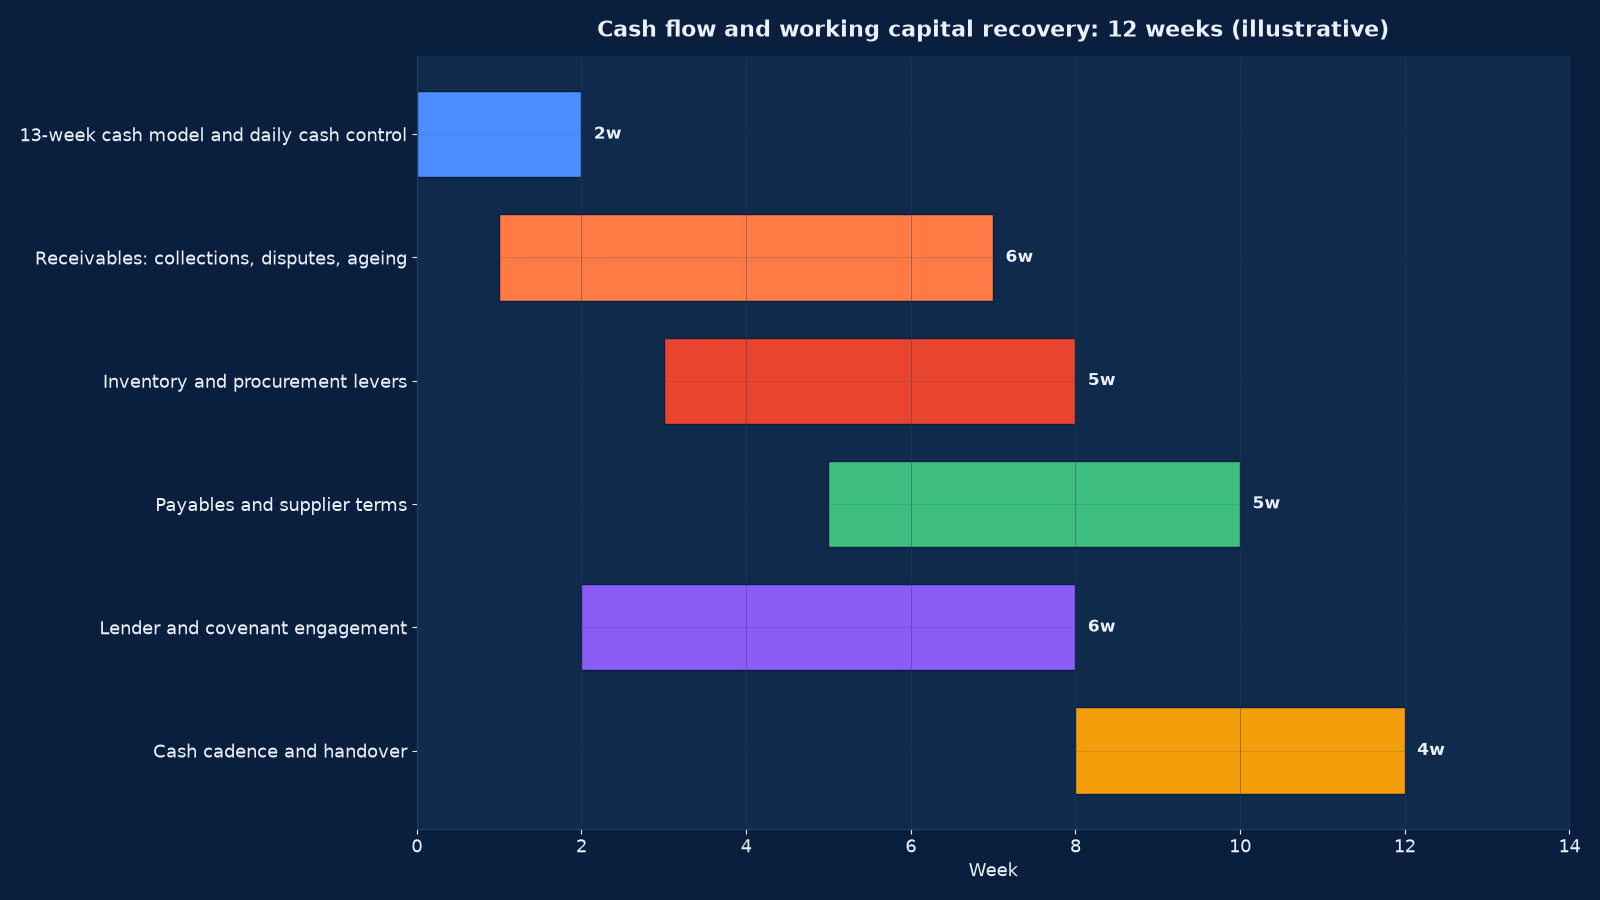
Chart values are an illustrative planning model based on typical UMC engagements and published industry benchmarks. They are not a guarantee of results on any specific project.
The Twelve-Week Programme
| Phase | Weeks | Activities | Output |
|---|---|---|---|
| Cash visibility | 1–2 | 13-week forecast from ledgers, daily cash control established, immediate cash actions listed, payment release process agreed | A forecast the leadership team believes and a list of two-week actions |
| Receivables | 2–7 | Ageing-based collection process, named owners per debtor, dispute resolution, terms enforcement, weekly debtor meeting | DSO falling with the process documented |
| Inventory and procurement | 4–8 | Coverage analysis, slow-moving stock decisions, reorder parameters, supplier consolidation and lead-time review | Inventory days falling and a reorder policy that holds |
| Payables and terms | 6–10 | Supplier ranking by criticality, terms renegotiation, payment scheduling, statutory dues current | Agreed terms in writing and a protected critical-supplier list |
| Lender and covenant | 3–8 | Headroom tracking, covenant calendar, facility review, financing case if required | A credible lender position and any facility change documented |
| Cadence and handover | 9–12 | Weekly cash meeting embedded, forecast maintained by your team, targets reset, reporting agreed | Cash discipline owned internally with a monthly report to the owner or board |
The Weekly Cash Meeting
One meeting, forty-five minutes, same time every week, and it is the mechanism that makes everything else hold.
- Open against forecast. Last week’s actual receipts and payments against the forecast, with the variance explained in one line each.
- The trough. The lowest projected balance in the next thirteen weeks and the week it occurs. If it has moved, why.
- Top twenty debtors. Value, ageing, committed date, owner. No debtor discussed twice without a changed date or an escalated action.
- Payment releases. What is being paid this week and what is being held, with the reason recorded.
- Statutory and debt service. Confirming the next thirty days of fixed obligations are funded.
- Exceptions. Any covenant concern, any supplier threatening to stop, any customer at risk — escalated same day rather than at the next meeting.
The meeting must have a chair with authority to release or hold payment, and its outputs are recorded. Within six weeks it stops feeling like crisis management and starts being how the business runs.
Measuring the Recovery
Figures 1 and 2 use subsets of these. The full set is baselined in week one and reported weekly during recovery, monthly afterwards.
| Measure | Definition | Target |
|---|---|---|
| DSO | Debtor days outstanding, calculated on the last quarter’s revenue | Falling to terms plus a small tolerance |
| DIO | Inventory days on hand | Falling to the level lead times actually require |
| DPO | Creditor days | Rising to negotiated terms, not beyond them |
| Cash conversion cycle | DSO + DIO − DPO | Falling quarter on quarter |
| Forecast accuracy | Weekly variance of actual to forecast receipts and payments | Inside 5% by week 8 |
| Over-90-day debtors | Value and count | Trending to zero |
| Dispute rate | Share of invoices queried or disputed | Falling — it is a quality measure |
| Unbilled revenue | Value of work delivered but not invoiced | Measured weekly, trending down |
| Facility headroom | Available against each covenant, not just the borrowing limit | Positive with a buffer, tracked monthly |
| Statutory dues | Any arrears in GST, TDS, PF, ESI or professional tax | Zero |
| Cash released | Cumulative cash generated by lever against the baseline | Tracked to delivery, not to plan |
Report cash released against the baseline, not as a percentage improvement, because a percentage of an unmeasured baseline is not evidence. And keep forecast accuracy at the top of the report: it is the measure that tells you whether the business has regained control or is merely lucky this month.
Engagement Models
| Model | Duration | Deliverables | Best when |
|---|---|---|---|
| Cash diagnostic | 10–14 days | 13-week forecast, immediate cash actions, lender position, funding requirement | Liquidity is the immediate threat and nothing else can wait |
| Full working capital recovery | 12 weeks | All six phases above with measured cash released and handover of the forecast | The standard engagement, and the right one for most situations |
| Receivables recovery only | 6–8 weeks | Collection process, dispute resolution, debtor ownership, terms enforcement | DSO is the problem and everything else is acceptable |
| Financing case and lender support | 4–8 weeks | Forecast, funding requirement, facility options, the pack and support through the conversation | New or restructured facilities are needed |
| Ongoing cash management | Monthly | Forecast maintained, weekly meeting chaired or supported, monthly reporting to owner or board | Finance capacity is thin or the owner wants independent eyes on cash |
What Good Looks Like After Twelve Weeks
The programme has worked when cash stops being a source of anxiety and becomes a managed number.
- A thirteen-week forecast exists, is updated weekly by your finance team, and is accurate to within five per cent.
- Every debtor above a threshold has a named owner and a committed payment date.
- DSO, DIO and DPO have each moved in the right direction and the targets are in the monthly report.
- Statutory dues are current and on a calendar with an owner.
- Suppliers are ranked by criticality and the critical ones are paid per agreed terms.
- Facility headroom is tracked against every covenant monthly, so a breach is anticipated.
- The weekly cash meeting runs without us and produces decisions rather than discussion.
- The next seasonal trough is funded in advance rather than discovered in the month.
Two things usually follow. Where the cash problem was a symptom of unprofitable revenue, the margin work in our cost rationalisation service becomes the next programme. Where it was a symptom of no operating discipline at all, the unified operating layer is what stops the cycle repeating — and the CEO survey insights on cost pressure and resilience suggests most leaders already know which of the two they are living with.
Frequently Asked Questions About Cash Flow & Working Capital Recovery
How quickly can you release cash?
The fastest cash is unbilled revenue, unclaimed credits and disputed invoices — usually identified in week one and often collected within three. Collections process work releases cash from week four onwards. Inventory takes six to twelve weeks. Terms renegotiation four to ten. A realistic expectation is a material release inside six weeks and the full effect by week twelve.
We are profitable. Why is cash the problem?
Because profit and cash are measured at different moments. Revenue is recognised on delivery; cash arrives on collection. If you deliver in week one and collect in week thirteen, every sale consumes cash for twelve weeks first. Add growth, inventory and any capital spending and a profitable business can be chronically short of cash. This is a timing and working capital problem, and it is fixed with process rather than with more sales.
Should we take invoice discounting or factoring?
It is a legitimate instrument where your debtors are concentrated and creditworthy, and where you need cash against specific receivables rather than a general facility. Read the recourse provisions carefully — if you retain the credit risk, you have sold timing but not risk. Consider whether notification affects customer relationships. And do not use it to avoid fixing the collection process: discounting an inefficient ledger means paying a charge to fund a problem.
Our suppliers will not extend terms. What then?
Then the lever is elsewhere, and forcing it is counter-productive. Consolidating volume with fewer suppliers often produces terms that spreading it does not, because you become worth negotiating with. Where terms genuinely cannot move, the cash has to come from receivables, inventory or margin — which in most businesses is the larger opportunity anyway.
How do we handle a customer who simply will not pay?
Decide deliberately rather than drifting. Past ninety days, an overdue debt is a financing decision you are making for free. The options are a formal demand, a payment plan in writing, stopping supply, a collection agency, or legal action — and the right one depends on the value, the relationship and whether you want the customer afterwards. What is never right is continuing to supply on the same terms while the balance grows.
What is the MSME forty-five day rule and does it affect us?
Where you buy from a micro, small or medium enterprise, payment is required within forty-five days of acceptance of goods or services, and delays can be reported by the supplier and have tax disallowance consequences. If you sell as an MSME, it is a lever you can use against larger buyers. Either way it is a constraint to plan around rather than a lever to pull, and a business that has been stretching MSME suppliers has a compliance exposure alongside its cash one.
Do you talk to our bank?
With your authorisation, and after you have seen the position yourself. We build the pack — forecast, funding requirement, plan and the management information behind it — and we can attend the meetings. What we will not do is present a forecast we do not believe. Lenders have seen optimistic thirteen-week models before, and a credible conservative one is worth more than an appealing one.
What if the cash need is structural rather than timing?
Then working capital work will help but will not solve it, and we will say so in week two. A structural gap means the business needs more permanent funding than it has — from equity, term debt matched to asset life, or a change in the business model. Our distressed restructuring service covers the capital-structure routes, and the diagnostic determines which situation you are in.
How much of this can our own finance team do?
Most of it, and they should — which is why the forecast is built in their format and handed over during the programme rather than at the end. What an external engagement adds is the authority to enforce terms with customers and suppliers, the willingness to make the unpopular decision about a client or a stock line, and a weekly rhythm that internal teams find hard to impose on themselves.
What does it cost?
Fixed fee by scope: the ten-to-fourteen-day cash diagnostic is the smallest, the twelve-week recovery is the standard engagement, and ongoing cash management is monthly. We size by revenue, debtor count and site complexity rather than by hours. The comparison worth making is against the cost of the current position: overdraft interest, emergency borrowing, lost supplier terms and management time spent on cash.
What should we do first?
Build the thirteen-week forecast. Not a budget, not a cash flow statement from the accounts — a weekly model from the bank statements and the ageing. It takes two to three days, and it answers the only question that matters right now: when is the trough, how deep, and what has to happen before it.
Start With the Thirteen-Week Forecast
If cash is the immediate pressure, we can build your thirteen-week forecast from ledgers and bank statements within two to three days of engagement and tell you exactly where the trough is, how deep, and what has to happen before it. Everything else in the programme follows from that number.
Contact Unified Management Consulting to arrange a confidential first conversation.
Related Services
Cash and working capital recovery works alongside our other turnaround and consulting services:
- Mr Avinash Sharma — who leads cash and turnaround engagements personally
- Risk, Governance & Business Continuity Support — the framework that keeps cash discipline in place after the recovery
- Business Strategy Consulting — where the funding requirement is structural rather than timing
- Data Science Services for Business Analytics — forecasting and demand modelling behind inventory decisions
- Cloud Cost Optimisation & FinOps — the same lever discipline applied to technology spend
- Custom CRM Development & Integration — the systems that make credit control and billing discipline enforceable
- Market Research & Competitive Analysis — where terms and pricing are the constraint rather than process
- Unified Top-Level Business Management & Handling — one operating layer across finance, operations and people, with decision rights and cadence
- 30-Day Turnaround Diagnostic — thirty days to an evidenced position across cash, cost, margin, contracts and governance
- Distressed Business Restructuring — the options ladder from consensual standstill to formal insolvency, with lender and stakeholder plans
- Interim & Fractional Leadership — a written mandate with published decision rights for CEO, COO, CFO and transformation roles
- Cost Rationalisation & Margin Recovery — cost-base decomposition, contribution by customer and product, cost to serve and pricing discipline
- Predictive Analytics & Demand Forecasting — use case selection, naive baselines, walk-forward validation, prediction intervals and model operations