
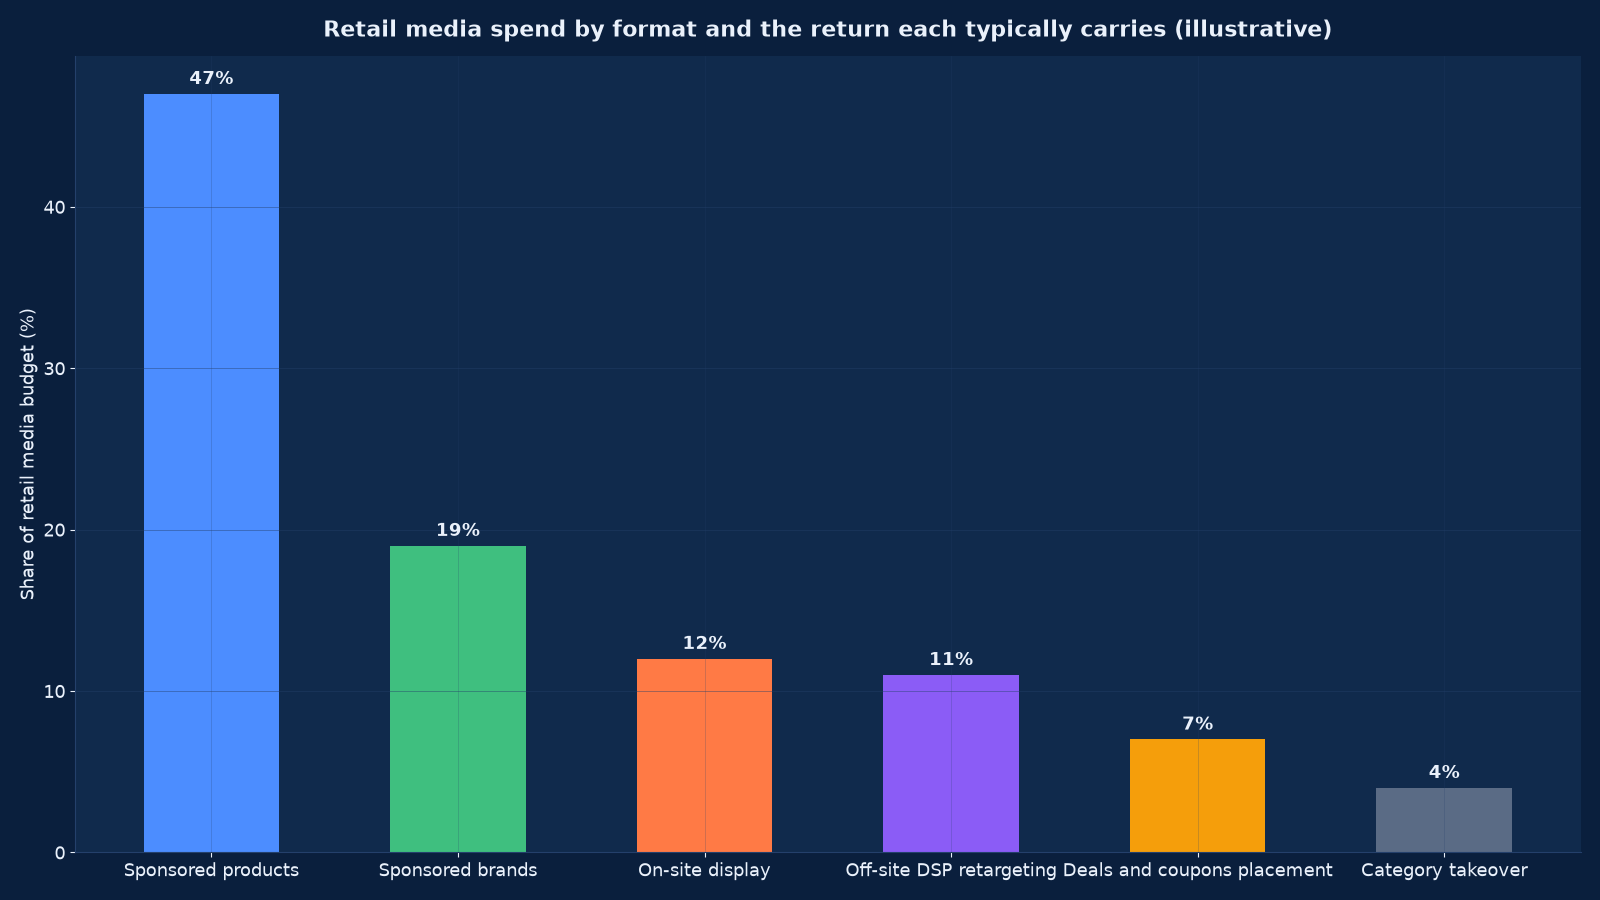
Chart values are an illustrative planning model based on typical UMC engagements and published industry benchmarks. They are not a guarantee of results on any specific project.
Retail media is the only advertising channel where the seller of the inventory also owns the transaction data, reports the result, and takes a margin on both. That is an opportunity and a conflict of interest at the same time.
Retail media networks are the advertising businesses run by retailers and marketplaces: sponsored product listings, on-site display, brand stores, deal placements, and off-site demand side platforms retargeting a retailer’s shoppers. For any business selling through Amazon, Flipkart, quick-commerce platforms, or vertical marketplaces in beauty, fashion, grocery or electronics, retail media is now usually the highest-intent inventory available — and the least independently measured. Unified Management Consulting builds the merchandising readiness, campaign architecture, profitability frame and incrementality discipline that turn it from a platform-reported cost of doing business into a governed channel.
🛒 Retail Media Networks — Quick Summary
| Component | What We Deliver |
|---|---|
| Merchandising readiness | Content, imagery, pricing, stock availability and category placement fixed first, because advertising a poorly merchandised listing pays for a worse conversion rate. |
| Platform and format selection | Which marketplaces and which formats are worth buying for your catalogue, based on where your shoppers actually are and what each format can prove. |
| Campaign architecture | A structure that separates harvesting from discovery, prevents campaigns competing against each other, and makes performance attributable to a decision. |
| Bidding and budget governance | Placement-level bids, match-type strategy, dayparting where supported, and budget pacing rules that survive a sale week. |
| Profitability frame | Advertising cost of sales and total advertising cost of sales against contribution margin per SKU, not against revenue alone. |
| Deal and promotional placement | Event planning, deal economics, stock commitment and post-event dip managed as one decision. |
| Off-site and DSP | Retargeting and prospecting on retailer audience data, bought only where the measurement can be reconciled to your own sales. |
| Incrementality and cannibalisation | Holdout tests and organic-share tracking to establish how much advertised revenue was incremental rather than relocated. |
| Reporting and reconciliation | Platform reporting reconciled to marketplace settlement statements and to your own order data, with a named owner and a monthly cadence. |
Retail media is planned within the wider mix described in our media planning and buying service and measured with the machinery in Marketing Mix Modelling & Attribution and Analytics & Attribution (GA4). Where demand is lumpy or a deal requires stock commitment, Predictive Analytics & Demand Forecasting supplies the volume forecast, and Conversion Rate Optimisation (CRO) supplies the listing-side improvement that makes every rupee of media work harder.
Formats: What Each One Buys and What Each One Can Prove
Eight formats. The critical column is the third: a format is worth buying only if it can produce evidence, and several cannot produce the evidence they are usually judged on.
| Format | What it is | What it can prove | What it usually costs to get wrong |
|---|---|---|---|
| Sponsored products | Auction-based placement of individual listings in search results and product pages | Direct attributed sales, cost of sales per SKU, and search-term level demand | Advertising a listing whose content, price or availability is not competitive — the spend buys a worse conversion rate |
| Sponsored brands | Brand-level placement with a storefront or curated product set, usually at the head of search | Brand presence and category-level traffic; sales attribution is weaker and often shared | Running it as a sponsored-products substitute and judging it on the same metric |
| Sponsored display / on-site display | Audience- and product-targeted display on and around the marketplace | Reach and retargeting of category shoppers; attribution windows vary widely by platform | Accepting a long attribution window as though it were measured contribution |
| Off-site DSP | Programmatic buying using retailer audience data, delivered outside the marketplace | Incremental reach to known shopper segments, where a holdout is run | No holdout, so new customers acquired are indistinguishable from existing ones retargeted |
| Deal and event placement | Paid or negotiated prominence during sale events and festival windows | Volume lift during the window, and the post-event dip that follows it | Committing stock and discount without modelling the dip, then reporting the spike as profit |
| Brand store and content | Owned brand destination and rich content inside the marketplace | Dwell, engagement and assisted conversion within the platform | Building it as a design project without a traffic plan to reach it |
| Category takeover and homepage | Fixed-price premium placement for a defined period | Reach and share of category impression, at a negotiated price | Buying it without a stock and fulfilment plan able to absorb the demand it creates |
| Sampling and trial programmes | Paid distribution of samples to targeted shopper segments | Trial and repeat-purchase behaviour, where follow-on measurement exists | Stopping at samples distributed, which measures logistics rather than effect |
The structural problem. Sponsored products attributes a sale to a click inside a platform that also owns the sale. Sponsored display attributes a sale to a view inside an attribution window the platform chose. Off-site DSP attributes a sale to an audience the platform defines. In each case the measurement is produced by the party selling the inventory, using data the advertiser cannot see. That is not fraud; it is a conflict of interest, and the only remedy is reconciliation to your own order data plus an occasional holdout test.
Which Networks Matter, and What Varies Between Them
Retail media is not one channel; it is a category of channels with materially different data maturity. Platform capabilities, reporting granularity and auction mechanics change frequently, so the table describes structure rather than current features — every engagement starts by verifying what each network actually offers today.
| Marketplace type | Examples in the Indian market | Inventory worth buying | Practical note |
|---|---|---|---|
| Horizontal marketplaces | Amazon India, Flipkart | Sponsored products at scale, sponsored brands for catalogue breadth, deal placement in festival windows | The most mature reporting and the most competition; auctions are dense, so listing quality decides whether spend converts |
| Quick commerce | Blinkit, Zepto, Swiggy Instamart, BigBasket Now | Category and search placement for fast-moving grocery, personal care and household ranges | Very short purchase cycles and tiny baskets; advertising must be judged on contribution per order, not on revenue |
| Grocery and modern trade online | JioMart, BigBasket, regional chains’ own apps | Sponsored listing and category placement, plus shopper-basket promotions | Data maturity varies widely; establish what is reported before committing budget |
| Vertical marketplaces | Nykaa (beauty), Myntra and Ajio (fashion), Tata CLiQ, FirstCry (parenting), PharmEasy (health) | Category-specific sponsored placement, editorial and curation adjacency, sampling | Audience intent is stronger and competition narrower than on horizontal platforms; content and curation matter as much as bids |
| Electronics and appliance retail | Croma, Reliance Digital, Vijay Sales, and manufacturer own-site stores | On-site sponsored placement, financing and exchange offer adjacency | High-ticket, long consideration; retail media here behaves like search rather than impulse buying |
| D2C own-site retail media | Brand-owned storefronts selling their own inventory | Search and category placement, cross-sell units, email and messaging adjacency | You own the data entirely, so measurement is honest — but the audience is much smaller and must be grown rather than harvested |
| Global networks (for exporters) | Amazon global marketplaces, Walmart Connect, Instacart, Criteo retail media | Sponsored products and DSP in the destination market | Currency, tax and inventory placement rules differ per marketplace; treat each as a separate market with its own economics |
The selection test. Three questions decide whether a network is worth entering: are your shoppers there in volume, does it report at the level you need to manage it (SKU, search term, placement), and can you reconcile its reported sales to your own settlement statements? A network failing the third question cannot be governed, only funded. Our e-commerce platform case study and the WooCommerce mobile store build are both examples of the own-site end of this table, where the data is entirely yours.
Merchandising Readiness: The Eight Prerequisites
Retail media amplifies whatever it is pointed at. Pointed at a well-merchandised listing it compounds; pointed at a weak one it makes an existing problem more expensive, faster.
| Prerequisite | Why advertising fails without it | How it is fixed |
|---|---|---|
| Competitive price position | A sponsored listing priced above visible alternatives converts badly; the auction simply makes the poor conversion more expensive | Price benchmarking against the visible competitive set per SKU, with a floor and a rule for promotional periods |
| Stock availability | Advertising an item that goes out of stock wastes spend and suppresses organic rank when it returns | Availability thresholds that pause campaigns automatically, and stock planning tied to the campaign calendar |
| Listing content and imagery | Thin titles, weak bullets, poor images and no video produce a low conversion rate that no bid can fix | A content standard per category: keyword-informed titles, complete attributes, image set, video where supported, and answers to the questions buyers actually ask |
| Reviews and rating | Rating is a conversion driver and a placement input; a low-rated SKU burns budget | A review-generation and issue-resolution process, and a rule for which SKUs are advertisable at all |
| Buy-box or equivalent eligibility | Where multiple sellers share a listing, advertising can send traffic to a competitor’s offer | Eligibility and pricing checks before campaigns run, and a decision on whether to advertise shared listings at all |
| Category and browse placement | Organic placement determines how much paid support is needed; a SKU invisible in browse needs a different plan from one already ranked | Category mapping, attribute completeness and browse-node correctness before paid support |
| Contribution margin known per SKU | Without it, cost of sales targets are arbitrary and profitable volume is indistinguishable from loss-making volume | A landed margin per SKU including fees, fulfilment, returns and payment cost — the input to every bid decision |
| Order and settlement data flowing | Platform-reported sales cannot be reconciled, so performance is unverifiable | Settlement reports and order extracts ingested on a schedule, matched to campaign data |
Sequencing rule: fix the eight prerequisites on the SKUs you intend to advertise before increasing spend on them. In practice this means a readiness pass across the advertisable catalogue in weeks one to three of the programme, and a rule that a SKU below the readiness floor does not receive budget. This is the single most reliable way to reduce cost of sales without touching a bid.
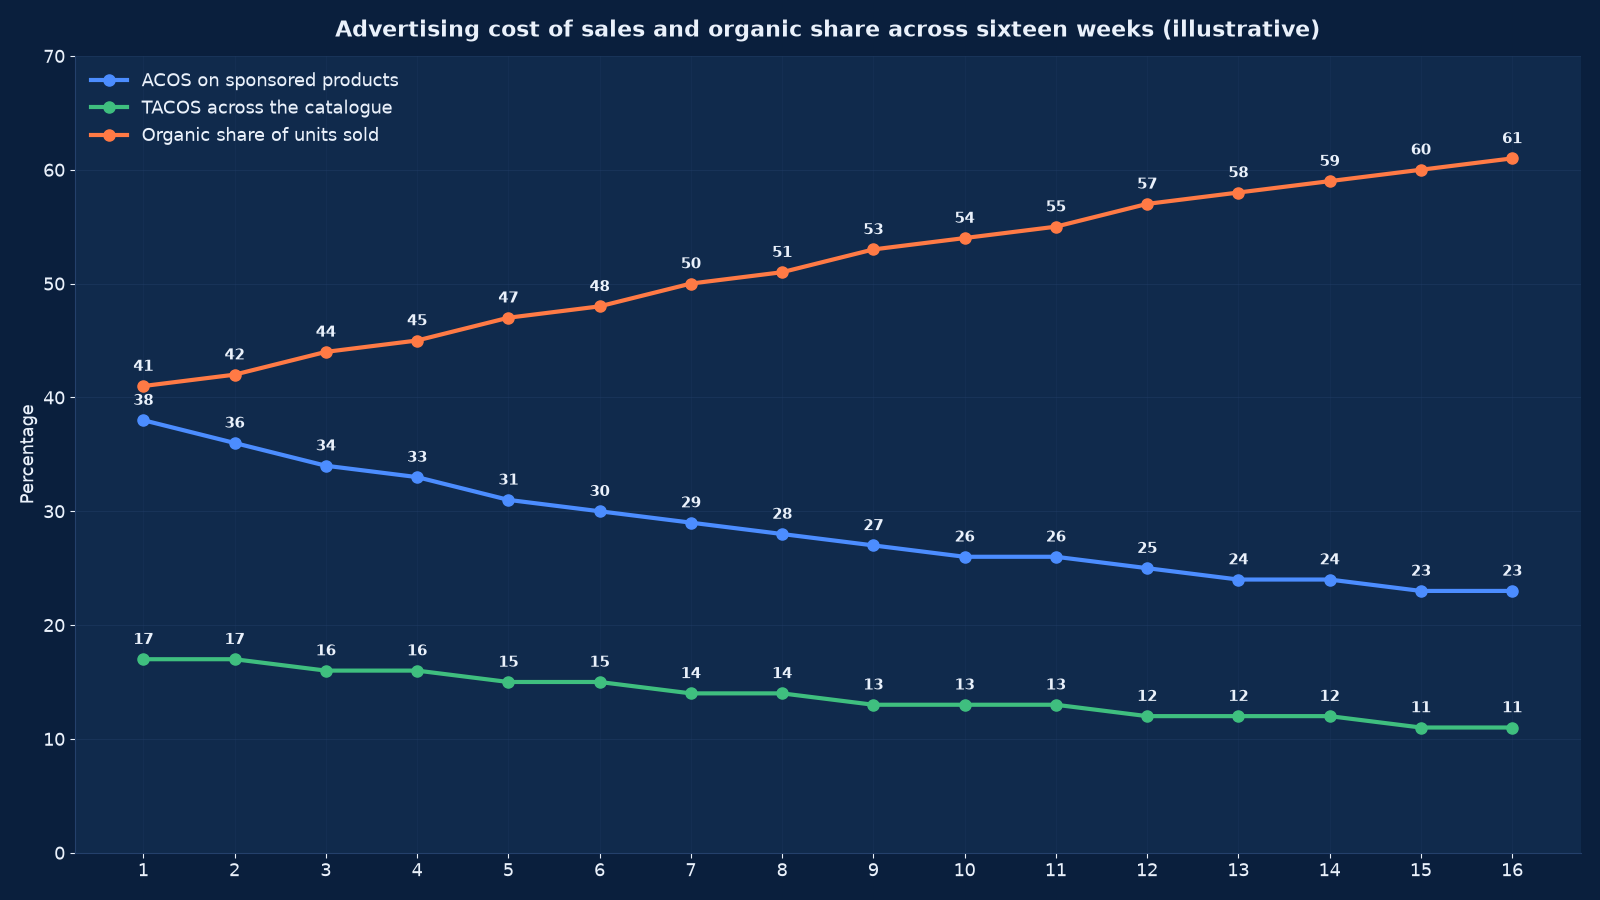
Chart values are an illustrative planning model based on typical UMC engagements and published industry benchmarks. They are not a guarantee of results on any specific project.
The Profitability Frame: ACOS, TACOS and Contribution
Eight metrics, each with a legitimate use and a common misuse. The most frequent error is managing to ACOS alone, which optimises the platform’s attribution rather than your contribution.
| Metric | Definition | Use it for | Do not use it for |
|---|---|---|---|
| ACOS | Ad spend divided by attributed ad sales, usually per campaign or SKU | Comparing campaigns and SKUs within the platform, and setting bid ceilings | Judging profitability on its own — it ignores margin and organic cannibalisation |
| TACOS | Ad spend divided by total sales including organic | The health of the account over time, and whether advertising is building organic position | Comparing accounts of different sizes or lifecycle stages without context |
| Contribution after media | Landed margin per order less allocated ad spend | Deciding whether a SKU should be advertised at all, and at what bid ceiling | Anything requiring a fixed-cost allocation, which distorts SKU-level decisions |
| Incremental ROAS | Attributed return adjusted by a holdout-measured incrementality factor | Allocating budget between SKUs and categories on true contribution | Routine weekly bidding, which cannot wait for a test |
| Organic share of units | Organic units divided by total units sold | Whether paid spend is building rank and repeat purchase or merely substituting for organic | Short-term performance judgement; it moves slowly |
| New-to-brand share | Share of advertised sales from customers new to the brand, where the platform reports it | Prospecting value, and whether DSP and sponsored brands are acquiring rather than recapturing | Assuming it is independently verified — the definition belongs to the platform |
| Impression share and lost share | Share of eligible impressions won, and the share lost to rank or budget | Deciding whether the constraint is bid, budget or relevance | Treating a high lost share as automatically worth buying — it may be unprofitable inventory |
| Post-event dip | Sales in the weeks following a deal event, against the pre-event baseline | The true economics of a promotional placement | Nothing else — but omitting it is how a profitable-looking event is actually a loss |
The frame we install. A landed contribution margin per SKU, including marketplace fees, fulfilment, returns, payment cost and any co-op funding. From that, a bid ceiling expressed as a break-even ACOS per SKU. Then three operating bands — harvest SKUs run below break-even, growth SKUs at or slightly above it with a stated payback horizon, and test SKUs above it for a defined period with a review date. Any SKU outside a band is a decision, not an accident. This is the same contribution logic as Cost Rationalisation & Margin Recovery applied at SKU level, and the forecast behind the growth band comes from Predictive Analytics & Demand Forecasting.
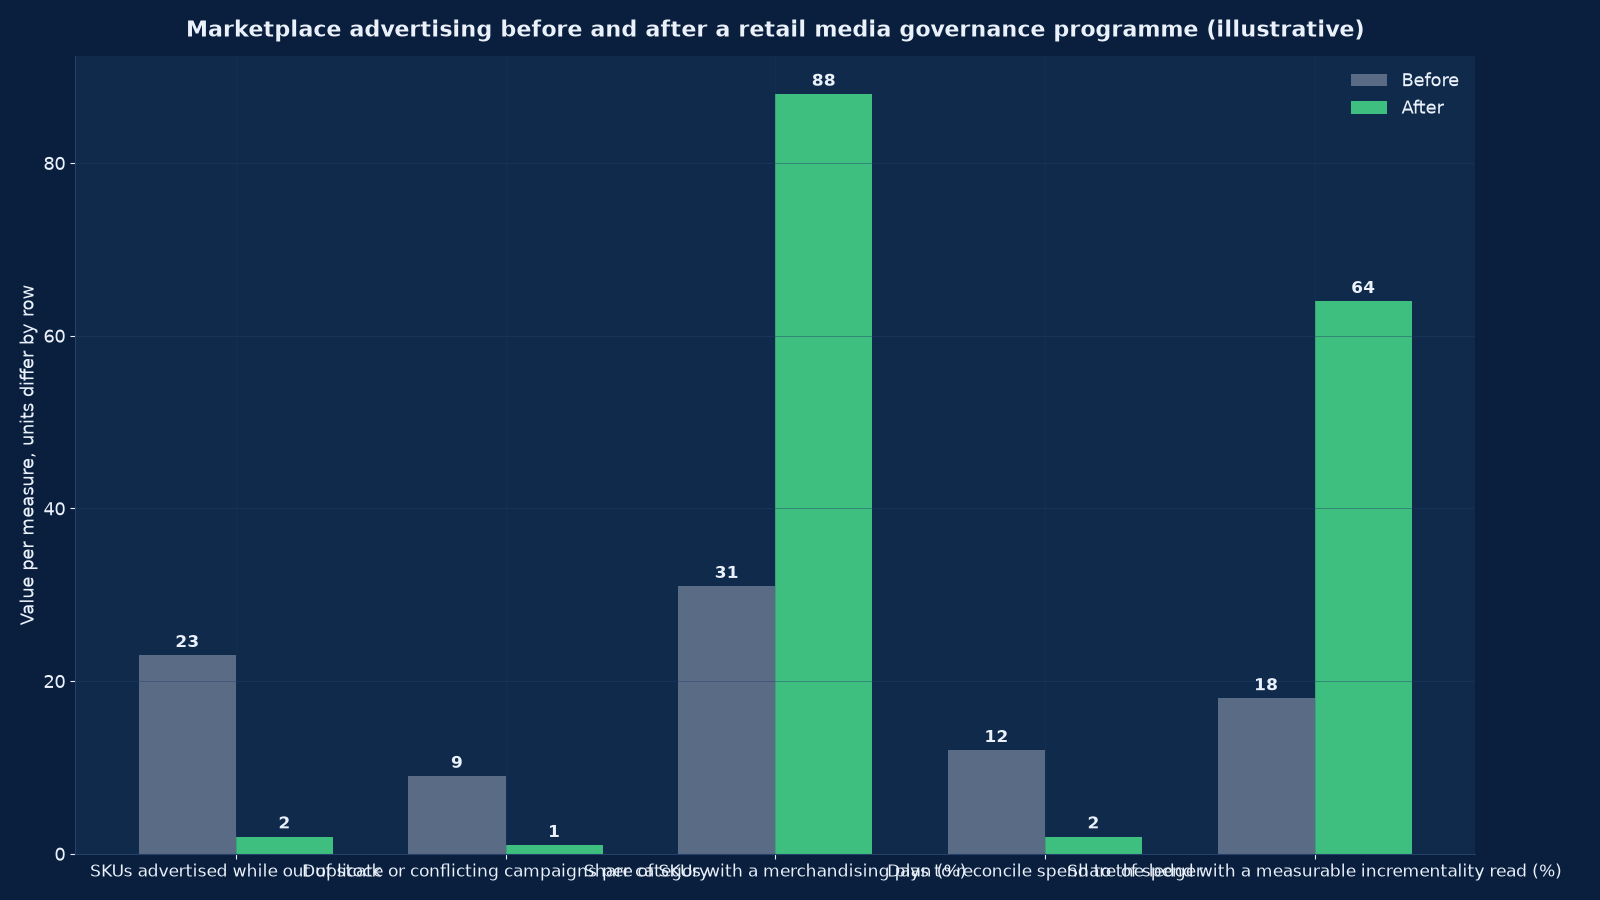
Chart values are an illustrative planning model based on typical UMC engagements and published industry benchmarks. They are not a guarantee of results on any specific project.
Campaign Architecture and Governance
Seven layers, each with a distinct job and a distinct cost-of-sales tolerance. Collapsing them into one account structure is why most marketplace reporting cannot answer a simple question.
| Layer | Purpose | Rules that keep it clean |
|---|---|---|
| Harvest — exact and high-intent | Capture demand already searching for your product or category | Separate campaigns per product group, placement-level bids, and search terms reviewed weekly to promote or negate |
| Defend — brand terms | Prevent competitors and resellers occupying your own brand searches | Isolated from harvest so its low cost of sales does not flatter the account average, and reviewed for incrementality separately |
| Discover — broad, category and product targeting | Find new demand and new converting search terms | A defined budget share with a stated tolerance for higher cost of sales, and a promotion rule moving winners into harvest |
| Competitor and conquest | Target competitor product pages and terms where your offer is genuinely stronger | Only on SKUs with a price, rating or feature advantage; otherwise it buys expensive non-conversion |
| Lifecycle — new SKU launch | Establish rank and review velocity for a new listing | A time-boxed budget above break-even with an explicit graduation criterion and an end date |
| Clearance and slow-moving | Move aged stock at a controlled loss | Priced against the cost of holding rather than against margin, and capped so it does not consume harvest budget |
| Negative and exclusion layer | Stop spend reaching terms, placements and audiences that cannot convert | Maintained as a shared list with a change log; the most neglected and highest-return routine in the whole structure |
The governance that holds it. One negative-match list with a change log; a documented promotion rule for moving a converting search term from discovery to harvest; a pause rule tied to stock availability; and a single owner for bid changes so the decision log means something. Without the last point, a month of unrecorded bid fiddling makes the post-campaign review an exercise in reconstruction. Our campaign optimisation guide covers the same discipline for paid search and social, and our paid search best practices the auction mechanics underneath.
Incrementality: The Measurement the Platform Will Not Sell You
Seven questions that platform reporting cannot answer, because answering them would reduce the reported return. Each has a method, and each is worth running at least once a year on the SKUs that carry the most spend.
| Question | Method | What it settles |
|---|---|---|
| Was the advertised sale incremental? | Geo or SKU-level holdout: pause or reduce campaigns on a matched set and measure the difference in total sales, not attributed sales | How much of attributed revenue would have happened anyway — the number platform reporting structurally cannot give you |
| Did advertising cannibalise organic? | Track organic share of units alongside spend; compare periods of high and low spend on matched SKUs | Whether paid spend is substituting for free traffic or building rank above it |
| Did the deal event pay? | Measure the event window, the post-event dip, and total contribution against a non-event baseline | Whether the spike was profit or borrowed volume |
| Is the DSP prospecting or recapturing? | New-to-brand share validated against your own customer file, plus a holdout | Whether off-site spend is acquiring customers you did not have |
| Which SKUs should stop being advertised? | Contribution after media per SKU, ranked, with a rule for the bottom decile | Where spend is destroying margin while reporting a healthy cost of sales |
| Is the platform’s attribution window realistic? | Compare attributed sales to total sales movement in a period of changed spend | Whether a long view-through window is claiming organic revenue |
| What is the true cost per order? | Ad spend plus fees, fulfilment, returns and payment cost, divided by orders | Whether the channel is viable at all at current price points |
The cheapest useful test. Pick a matched set of SKUs or a comparable market, reduce spend materially for four to six weeks, and measure total sales rather than attributed sales. If total sales fall by less than attributed sales would suggest, the difference is the cannibalisation you have been paying for. It is not elegant, it does not need to be, and it usually changes the budget. Our attribution models guide explains why this problem is general across channels, and Marketing Mix Modelling & Attribution is where a retail media line is reconciled with everything else you spend.
The Sixteen-Week Programme
| Phase | Weeks | Activities | Output |
|---|---|---|---|
| Baseline, reconciliation and margin | 1–2 | Twelve months of platform spend reconciled to settlement statements and order data, landed contribution margin built per SKU, baseline cost of sales and organic share established | A trustworthy baseline and a break-even cost of sales per SKU |
| Merchandising readiness pass | 2–4 | Price, stock, content, imagery, reviews and category placement assessed against a readiness floor across the advertisable catalogue | A readiness score per SKU and a fix list, plus a rule for which SKUs may receive budget |
| Architecture and governance design | 4–5 | Seven-layer campaign structure, negative-match list, promotion and pause rules, bid ceilings from contribution, owner and decision log defined | A documented operating model rather than a set of campaigns |
| Rebuild and launch | 5–7 | Campaigns restructured to the architecture, placement-level bids set, availability pauses configured, discovery budget ring-fenced | Live campaigns whose performance can be attributed to a decision |
| Deal and event planning | 6–8 | Event calendar, deal economics with stock commitment and post-event dip modelled, nomination and pricing prepared | An event plan priced against contribution, not against revenue |
| Off-site and DSP (where justified) | 8–10 | Audience selection, holdout design, reconciliation of new-to-brand reporting to your own customer file | Off-site spend with a measured incrementality read, or a decision not to buy it |
| Incrementality test | 10–14 | Matched-SKU or matched-market holdout run for four to six weeks, total sales measured against baseline | An incrementality factor per segment, applied to budget allocation |
| Reporting, ownership and handover | 13–16 | Reconciliation automated, reporting cadence established, thresholds and review calendar set, internal owner trained | A channel that runs on evidence with a named owner inside the business |
The Full Cost of the Channel
Media spend is one line of eight. Businesses that manage retail media on cost of sales alone are managing the smallest and most visible part of its economics.
| Cost element | Who charges it | Control |
|---|---|---|
| Media spend | The marketplace, via auction or fixed-price placement | Bid ceilings derived from contribution margin, budget bands per layer, and a stated working-media share |
| Marketplace selling fees | The marketplace, per unit and by category | Category classification reviewed; a mis-categorised SKU can carry a materially higher fee for years unnoticed |
| Fulfilment and storage | The marketplace or a third-party logistics provider | Inventory placement, aged-stock removal rules and size-tier accuracy; storage fees rise sharply on slow-moving stock |
| Returns and refunds | Borne by the seller | Return-rate monitoring by SKU with content and sizing fixes; advertised SKUs with high return rates are loss-makers at any cost of sales |
| Payment and settlement cost | Marketplace settlement terms and any financing cost of the float | Settlement cycle modelled into working capital; a long cycle is a real cost at scale |
| Creative and content production | Internal or agency | A per-listing content standard reused across marketplaces, with localisation versioned rather than rebuilt |
| Technology and tooling | Bidding, analytics and repricing tools | Invoiced separately at cost, justified against the hours saved and the margin protected |
| Advisory and management fee | Us, on a disclosed basis | A fixed or retainer fee with no margin on media and no platform incentive — we are not a reseller of retail media inventory |
The second, third and fourth lines are where the surprises live. A category classification error, an aged-stock storage charge and a high return rate each quietly convert a SKU with an acceptable advertising cost of sales into a loss-maker — and none of them appears in the platform’s advertising report. This is why week one of the programme builds a landed contribution margin rather than reading a dashboard. Cash Flow & Working Capital Recovery is the adjacent discipline where settlement cycles and inventory holding are addressed at business level.
Where Retail Media Programmes Fail
| Failure mode | How it presents | Prevention |
|---|---|---|
| Advertising unready listings | High spend, low conversion, rising cost of sales with no bid change | A readiness floor per SKU; no budget until it is met |
| Managing to ACOS alone | Cost of sales looks healthy while contribution falls | Bid ceilings derived from landed contribution margin, and bands per SKU role |
| Campaigns competing internally | Multiple campaigns bidding on the same term, inflating your own cost | A layered architecture with explicit term ownership and a shared negative list |
| Advertising out-of-stock SKUs | Spend continues against a listing that cannot convert, and rank is lost | Availability-triggered pauses, verified weekly |
| Deal economics judged on the spike | A successful event followed by three weak weeks, netted to a loss | Post-event dip modelled before the event is committed |
| Platform reporting accepted unreconciled | Attributed sales exceed what settlement and order data show | Monthly reconciliation to settlement statements and your own orders |
| No incrementality read | Budget grows because reported return grows | At least one holdout test a year on the highest-spend segment |
| DSP bought without a holdout | ‘New-to-brand’ sales that turn out to be existing customers retargeted | New-to-brand validated against your own customer file, with a holdout |
| Content and creative not localised | One listing adapted poorly across categories, languages and marketplaces | A content standard with versioning, owned rather than improvised per platform |
| No named owner | Bids changed by whoever has platform access, with no decision log | One owner, one decision log, one review cadence |
Running This in India
Conditions that change the programme rather than merely the price.
Quick commerce changes the arithmetic. Basket sizes are small, purchase cycles are measured in hours and fulfilment costs per order are high, so a cost of sales that looks acceptable on a large-basket marketplace can be loss-making on quick commerce. Contribution per order, not per rupee of revenue, is the governing measure — and it must include the delivery economics the platform passes through.
Festival windows carry disproportionate volume and disproportionate discounting. A large share of annual category demand falls in the festive quarter, when auction density and deal expectations both peak. Planning the event calendar against the festival dates, committing stock early, and modelling the post-event dip are what separate a profitable festival from a busy one.
Regional and linguistic variation. Search behaviour, category penetration and price sensitivity differ materially across metros, tier-two cities and specific language markets. Where a marketplace supports regional targeting or separate listings, treat them as separate markets with separate economics rather than one national campaign with an averaged bid.
Marketplace concentration risk. Where one platform carries most of your category sales, its fee changes, policy changes and account actions are existential rather than operational. Diversification across networks plus a genuine own-site channel is a risk position, not merely a growth one — which is why our own-site commerce work sits alongside this service. Risk, Governance & Business Continuity Support is where the concentration exposure is formally assessed.
Data maturity varies by network. Reporting granularity, attribution windows and audience capabilities differ considerably between horizontal marketplaces, vertical platforms and quick-commerce apps, and they change often. Every engagement begins by verifying what each network actually reports today rather than assuming parity, because a budget allocated on assumed capability is a budget that cannot be governed.
Tax, settlement and reconciliation. Advertising spend, marketplace fees and settlement receipts each carry distinct tax treatment, and the settlement statement rarely matches the advertising report line for line. Building the reconciliation in week one is what makes both the profitability frame and the finance relationship work; Data Warehouse & Lakehouse Build is where the settlement, order and campaign data are joined properly if the volume justifies it.
Engagement Models
| Model | Duration | Deliverables | Best when |
|---|---|---|---|
| Retail media audit | 3–4 weeks | Spend reconciled to settlement and order data, contribution margin per SKU, architecture and governance review, readiness assessment, prioritised findings | Cost of sales is rising and nobody can say why |
| Full sixteen-week programme | 16 weeks | Readiness pass, seven-layer architecture, bid ceilings from contribution, deal planning, off-site assessment, incrementality test, reporting and ownership handover | The standard engagement for a business treating retail media as a channel rather than a fee |
| Merchandising readiness only | 4–6 weeks | Readiness floor defined, catalogue assessed and fixed, advertisability rule, content standard | You want spend to work harder before you increase it |
| Deal and event planning | 4–6 weeks per cycle | Event calendar, deal economics with stock and dip modelled, nomination and pricing prepared, post-event measurement | Festival quarters and major sale events |
| Incrementality programme | 6–8 weeks | Holdout design and execution on matched SKUs or markets, incrementality factors, reallocation recommendation | Budget is large enough to test and has never been questioned |
| Managed retail media | Monthly | Ownership of campaigns, bidding against ceilings, negative list maintenance, availability monitoring, reconciliation and monthly reporting | You want the discipline maintained without the internal headcount |
What Good Looks Like After Sixteen Weeks
The programme has worked when the platform dashboard stops being the answer.
- Spend is reconciled monthly to settlement statements and your own order data.
- Every advertisable SKU has a landed contribution margin and a bid ceiling derived from it.
- The catalogue passed a readiness floor before budget was allocated to it.
- Campaigns sit in a seven-layer architecture with explicit term ownership and a shared negative list.
- Availability pauses are configured and verified weekly.
- Deal events are committed with the post-event dip priced in, not discovered afterwards.
- At least one incrementality test has run, and its factor is applied to allocation.
- Organic share of units is tracked alongside spend, so substitution is visible.
- Off-site spend, if any, is validated against your own customer file.
- One named person owns bids, the decision log and the monthly review.
Two follow-ons usually apply. Where readiness work reveals that conversion is the binding constraint rather than traffic, Conversion Rate Optimisation (CRO) is the next engagement and it lowers every cost-per-acquisition in the account. Where reconciliation shows the channel’s contribution depends on inventory and fulfilment economics, Cash Flow & Working Capital Recovery addresses the working capital side. Sales Analytics & Pipeline Intelligence applies the same stage-discipline logic to a direct sales channel, and our Google Ads ROI guide and our paid channel comparison cover the equivalent questions outside the marketplace.
Frequently Asked Questions About Retail Media Networks
Is retail media worth it if we already run Google and Meta ads?
Usually yes, because the intent is different. A marketplace search happens immediately before a purchase decision inside a transaction environment, which no external channel can replicate. But it should be planned inside the same mix rather than alongside it: if your marketplace spend is harvesting demand that your external search campaigns also claim, you are paying twice for one customer. That is a planning and measurement question, and it is the reason this service exists separately from channel execution.
Which marketplaces should we start with?
The one where your shoppers already are and which reports at SKU and search-term level. For most consumer businesses that is a horizontal marketplace; for beauty, fashion, grocery, parenting or electronics a vertical platform often gives stronger intent with narrower competition. The decisive question is the third one in section two: can you reconcile its reported sales to your own settlement and order data? A network you cannot reconcile cannot be governed, only funded.
What is a good ACOS?
There is no good ACOS in the abstract — only a break-even ACOS for a specific SKU, which is its landed contribution margin expressed as a percentage of price. A SKU with 40 per cent contribution can be advertised profitably at an ACOS that would destroy a SKU with 15 per cent. Week one of the programme builds that number per SKU, and it becomes the bid ceiling. Any target quoted without a margin behind it is a convention rather than a decision.
Why does our advertising cost of sales rise when we increase spend?
Two reasons, usually together. First, saturation: you exhaust the high-intent searches and begin buying broader, lower-converting terms. Second, cannibalisation: some of the incremental attributed sales were organic sales you now pay for. Both are visible if you track organic share of units alongside spend, and neither is visible in the platform’s report, which has no reason to distinguish them.
How do we know if a deal event was profitable?
Measure three things against a non-event baseline: sales in the event window, sales in the two to four weeks after it, and total contribution across both including discount, fees, storage and any aged stock created. The post-event dip is the part everyone omits, and it is what converts an apparently successful event into a loss. We model the dip before the event is committed, so the commitment is a decision with a number attached.
Should we use the marketplace’s DSP or off-site products?
Only with a holdout and only after validating new-to-brand reporting against your own customer file. The concern is structural: off-site products claim to acquire new customers, and the evidence for that claim is produced by the party selling it, using data you cannot see. Where a holdout shows genuine acquisition, it is often the most efficient prospecting available; where it does not, you have been paying to retarget customers you already had.
We sell on several marketplaces. Should the campaigns be run the same way?
No. Auction density, fee structures, fulfilment economics, reporting granularity and shopper behaviour all differ, so contribution per order differs and therefore bid ceilings differ. The architecture and governance can be common across platforms; the economics must be computed per platform. Running one averaged bid across several marketplaces systematically overpays on the cheap ones and underinvests on the profitable ones.
How much does stock availability really matter?
It is the most common silent waste in the channel. Advertising a listing that goes out of stock spends budget against zero conversion, and the resulting loss of sales velocity suppresses organic rank for weeks after stock returns — so the cost is not only the wasted spend but the recovery afterwards. Availability-triggered pauses configured in week five, and verified weekly, remove most of it. Where stockouts are frequent, the real problem is demand planning, which is our forecasting service.
Can you take over management of our existing campaigns?
Yes, and the first four weeks are a takeover rather than a rebuild: reconcile spend to settlement, build the contribution margin per SKU, map the existing structure against the seven layers, and identify what is competing internally or advertising unready listings. Restructuring before that baseline exists destroys the ability to compare, which is the only evidence you will ever have about whether the change worked.
Do you earn anything from the marketplaces?
No. We are not a reseller of retail media inventory, we take no platform incentive, rebate or partner margin, and our fee is a disclosed fixed or retainer amount. This matters more in retail media than in most channels, because the platforms operate partner programmes with revenue-share arrangements that create exactly the conflict of interest section one describes. An adviser paid by the platform cannot honestly tell you to spend less on it.
What should we do first?
A three-to-four-week retail media audit. It reconciles twelve months of spend to your settlement and order data, builds a landed contribution margin per SKU, assesses catalogue readiness, maps your campaign structure against the seven layers, and produces a prioritised findings list with the break-even cost of sales that every later bid decision depends on. It requires no change of platform, no budget increase and no system purchase.
Start With the Contribution Margin
Give us twelve months of platform spend, your settlement statements and your order data. In three to four weeks we will reconcile them, build a landed contribution margin per SKU, and hand you the break-even advertising cost of sales that turns every bid decision from a convention into a calculation.
Contact Unified Management Consulting to arrange a confidential first conversation.
Related Services
Retail media networks are managed alongside our other commerce, media and measurement services:
- Programmatic Advertising Services — the off-site and display buying discipline
- Google Ads Management Services — search demand outside the marketplace
- Conversion Rate Optimisation (CRO) — the listing and site-side improvement that lowers every cost per acquisition
- Analytics & Attribution (GA4) — reconciling platform reporting with your own measurement
- Marketing Mix Modelling & Attribution — placing retail media inside the total mix
- Predictive Analytics & Demand Forecasting — stock commitment for deals and events
- Data Warehouse & Lakehouse Build — joining settlement, order and campaign data at volume
- Email Marketing Campaign Services — the owned-audience channel a marketplace cannot take away
- Custom CRM Development & Integration Services — customer data behind new-to-brand validation
- Cost Rationalisation & Margin Recovery — the contribution discipline at business level
- Cash Flow & Working Capital Recovery — settlement cycles and inventory holding
- Signage Planning & Production Consulting — multi-site audits, statutory approvals, substrate specification, competitive tendering, install sequencing and maintenance
- Media Planning & Buying — audience-first channel mix, negotiated rate cards, frequency and brand-safety controls, live pacing and an independent post-campaign audit
- Out-of-Home & Digital OOH Advertising — corridor selection, CPM benchmarking, flighting, creative duration discipline and geofenced measurement
- Brand Performance & Creative Production — one narrative, a modular creative system, production economics, media-weighted testing and always-on optimisation