
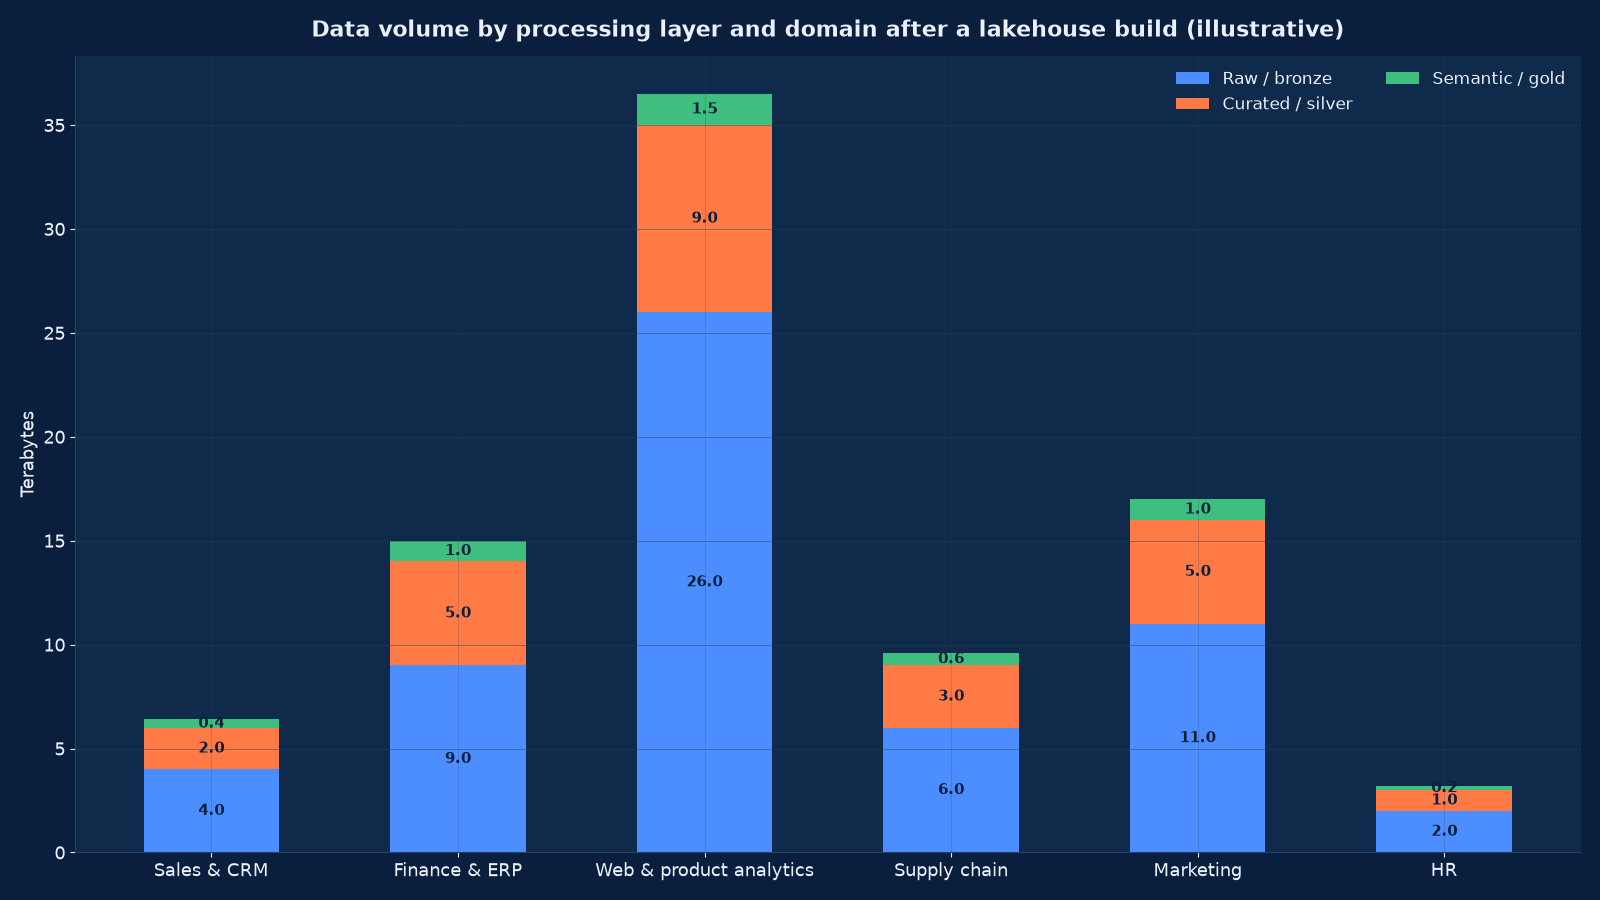
Chart values are an illustrative planning model based on typical UMC engagements and published industry benchmarks. They are not a guarantee of results on any specific project.
Most businesses do not have a data problem. They have several copies of the same data, each maintained by a different department, none of which agrees with the ledger.
A data warehouse or lakehouse is the single governed place where your operational systems meet: sales, finance, operations, web, supply chain and people data landed, cleansed, keyed, history-preserved and exposed through one semantic layer. Unified Management Consulting designs and builds these on Snowflake, BigQuery, Redshift, Databricks, Microsoft Fabric or managed Postgres, with the modelling, quality testing, lineage and cost controls decided before the first pipeline runs — because a warehouse built without them becomes the next source of disagreement rather than the end of it.
🗄️ Data Warehouse & Lakehouse Build — Quick Summary
| Component | What We Deliver |
|---|---|
| Source inventory and profiling | Every system, extract, owner, volume, refresh pattern, key structure and known defect documented before design begins. |
| Layered architecture | Bronze raw landing, silver cleansed and conformed, gold semantic and metric-ready — each with its own retention, access and cost profile. |
| Modelling discipline | Star schemas, conformed dimensions, slowly changing dimension handling and one definition of every entity that appears in more than one source. |
| Platform selection | Snowflake, BigQuery, Redshift, Databricks, Fabric or Postgres chosen on workload, team, existing commitment and three-year cost — not on benchmark claims. |
| Quality and observability | Tests on volume, freshness, uniqueness, referential integrity and reconciliation, alerting to a named person before a user sees a wrong number. |
| Lineage and documentation | Column-level lineage from source to semantic layer, so an unexpected number can be traced in minutes rather than days. |
| Cost engineering | Warehouse and compute spend modelled before build, with partitioning, clustering, scheduling and warehouse-size controls in place from day one. |
| Security and compliance | Role-based access, column masking, encryption, retention rules and the evidence pack auditors and lenders ask for. |
| Cutover and retirement | Parallel running against the legacy extracts, reconciliation signed off, and the old pipelines switched off on a named date. |
The warehouse is the foundation for Data Science Services for Business Analytics and for the reporting layer described in our BI dashboards service. Where the underlying systems themselves are duplicated and unintegrated, Enterprise Systems Integration & Tech-Stack Consolidation is the prior step, and Data Engineering for AI: RAG & Knowledge Systems is the specialist variant where the consumer is a model rather than a report.
The Problems a Warehouse Actually Solves
A warehouse is rarely justified by “we need better analytics”. It is justified by a specific, recurring cost. These are the eight we see most often, and each maps to a design decision later in the build.
| Symptom | What the business experiences | The underlying cause |
|---|---|---|
| The monthly argument | Sales, finance and operations each present a different revenue figure for the same month | No conformed dimension and no single definition: each system counts differently and nobody has reconciled them |
| The analyst bottleneck | Every new question takes days because someone must write a fresh extract and join it by hand | No curated layer, so each question starts from raw source data |
| History that does not exist | “What was this customer’s territory two years ago?” cannot be answered | Operational systems overwrite in place; no slowly changing dimension handling |
| Spreadsheets as infrastructure | Critical reporting depends on one workbook with eleven manual steps | The warehouse does not exist or does not cover the needed sources, so the logic lives in Excel |
| Unbounded cloud spend | The analytics bill grows every quarter while usage appears flat | No partitioning, clustering or scheduling design, and no cost owner |
| Failed pipelines found by users | A report is wrong for three days before anyone notices | No freshness, volume or reconciliation tests, and no alerting |
| Duplicated data stores | Three copies of customer data, each partially maintained | Each team built its own extract because the central one did not serve it |
| No audit trail | A regulator, auditor or lender asks how a number was produced and nobody can show it | No lineage, no version control on transformations, no change record |
Figure 2 quantifies the first two: the effort consumed by an ungoverned data estate is not spread evenly across analysis, it is concentrated in extraction, hand-maintained pipelines and reconciliation. That is the effort a warehouse removes.
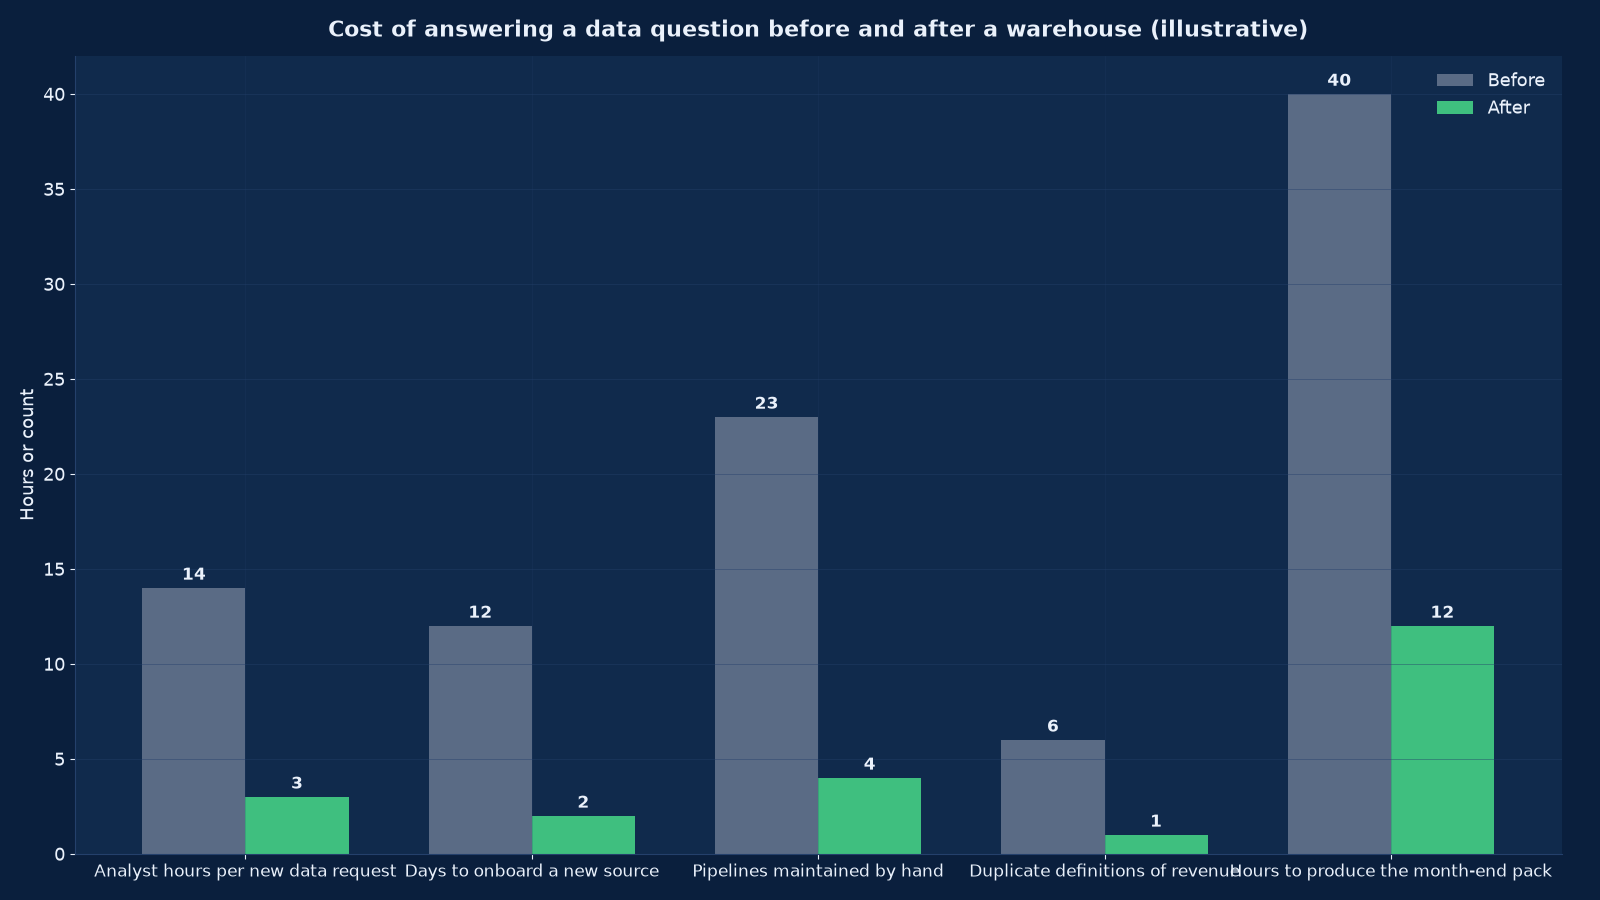
Chart values are an illustrative planning model based on typical UMC engagements and published industry benchmarks. They are not a guarantee of results on any specific project.
Warehouse, Lake, Lakehouse or Data Mart
The vocabulary causes more bad decisions than the technology does. These are the real options and the conditions that make each one right.
| Option | What it is | Choose it when | Do not choose it when |
|---|---|---|---|
| Data mart | A subject-area store serving one function, often on the BI platform’s own engine | One team, two or three sources, a narrow question set, and no expectation of growth | Two or more functions need the same entity defined once |
| Classic data warehouse | A structured, schema-on-write store with relational modelling, usually columnar | Finance-grade reporting, strong governance requirements, mostly structured sources | Most of your data is semi-structured, high-volume event data or you need cheap raw retention |
| Data lake | Cheap object storage holding raw data in native format, schema applied on read | High-volume event, log, IoT or unstructured data whose shape is not yet known | On its own for management reporting — a lake without a curated layer reproduces the ambiguity it was meant to remove |
| Lakehouse | Object storage with table formats and transactional metadata, giving warehouse semantics over lake economics | Mixed structured and semi-structured data, one platform for reporting and data science, cost-sensitive scale | The team has no engineering capability and needs a fully managed, minimal-operations product |
| Managed cloud warehouse | A fully managed columnar service with per-second or per-credit compute | You want the least operational burden and your workload is reporting-dominant | Compute is heavy and continuous enough that reserved capacity or a lakehouse is cheaper |
| Operational database replica | A read replica of the ERP or CRM used for reporting | Only as a stopgap for a single source and a single team | Never as the strategy: it cannot join sources, cannot preserve history and degrades the source system |
For most mid-market businesses the honest answer is a managed cloud warehouse with a small object-storage landing zone for raw extracts — functionally a lakehouse in all but name, chosen because it minimises operations rather than because of the architecture diagram. We recommend against a lake-first approach unless you genuinely have high-volume event data, because the curation work is the same and it arrives later.
The Layered Architecture
Three processing layers plus the metadata layer that governs them. The separation is not theoretical: it is what allows a raw extract to be replayed when a transformation changes, and what stops a dashboard from depending on a source system’s quirks.
| Layer | Purpose | Contents | Retention and cost |
|---|---|---|---|
| Bronze / raw | Land source data as delivered, immutably, so any later transformation can be replayed | Full or incremental extracts in native format, plus file metadata, load timestamps and source checksums | Longest retention, cheapest storage; no transformation applied |
| Silver / curated | Cleanse, deduplicate, conform and key; this is where entities become single and history becomes queryable | Conformed dimensions, typed and validated facts, slowly changing dimension history, rejection and exception tables | Medium retention; the layer most queries should hit |
| Gold / semantic | Present business-ready measures at the grain people think in | Star-schema marts, metric views, aggregate tables for dashboard performance | Shortest retention of detail, longest of aggregates; the layer dashboards consume |
| Orchestration and metadata | Run, monitor and document the above | DAGs, schedules, run history, test results, column-level lineage, data contracts | Retained for audit; inexpensive and disproportionately valuable |
The rules that make it work. Nothing in gold is computed from bronze directly. Rejections are stored, not discarded, so a failed row can be inspected and reprocessed. Every layer is reproducible from the layer below, which means a definition change is a re-run rather than a data recovery exercise. And the semantic layer — the metric definitions — lives in gold under version control, so changing gross margin is one reviewed commit rather than forty edited reports.
Source Inventory and Data Profiling
Weeks one to three are spent establishing what exists. This is unglamorous and it is where most of the programme’s risk is retired.
- Systems. ERP, CRM, HR, payroll, e-commerce, web analytics, marketing platforms, logistics, production, banking feeds, and every departmental database or workbook that holds authoritative information.
- Extract routes. API, direct read, replication, flat-file drop, vendor report export. Each has a latency, a rate limit and a failure mode, and each needs an owner.
- Volume and growth. Rows and bytes today, and the growth rate that determines whether the platform choice is affordable in three years.
- Keys and identity. What identifies a customer, product, employee or order in each source, and where the same real-world entity has different identifiers.
- Profiling. Null rates, distinct counts, format violations, duplicates, orphaned foreign keys, date ranges and impossible values — measured, not sampled.
- Reconciliation baseline. For every financial measure, the tie-out to the ledger for three closed periods, with differences documented.
The output is a source register with a data contract per source: the fields supplied, their definitions, the change-notice period, and the named business owner. Without contracts, the warehouse breaks whenever a vendor changes an API, and nobody is accountable for telling you. Our tech-stack consolidation piece covers the parallel question of how many of these sources should exist at all.
Platform Selection
Six credible options and the criteria that actually distinguish them. We run this against your workload, your team and your existing commitments, and we model three-year cost with your volumes rather than quoting a licence price.
| Criterion | Snowflake | BigQuery | Redshift | Databricks | Microsoft Fabric | Managed Postgres |
|---|---|---|---|---|---|---|
| Operating burden | Very low | Very low | Low to moderate | Moderate | Low | Low to moderate |
| Cost model | Per-credit compute, storage separate | Per-byte scanned or reserved slots | Provisioned cluster or serverless | Compute units plus storage | Capacity units across the Fabric estate | Instance size plus storage |
| Best workload | Mixed SQL reporting and data science | Large ad-hoc scans, event and marketing data | Established AWS estates, predictable heavy reporting | ML-heavy, streaming, complex transformation | Microsoft estates wanting one capacity across BI and data | Small estates, transactional reporting, tight budgets |
| Semi-structured data | Strong native VARIANT handling | Strong | Adequate | Strong | Adequate | JSONB, workable at small scale |
| Governed semantics | Views and metrics layers; often paired with a BI semantic model | Looker pairing is the intended route | Depends on BI layer | Unity Catalog plus a metrics layer | Power BI datasets are the semantic layer | Application-level |
| Cost-control levers | Warehouse sizing, auto-suspend, clustering, resource monitors | Partitioning, clustering, slot reservations, byte-scan discipline | RA3 resizing, concurrency scaling, result caching | Cluster policies, photon, spot and autoscaling | Capacity reservation and smoothing | Instance right-sizing, read replicas |
| Typical mid-market trap | Warehouses left running; per-credit spend drifting | Unpartitioned tables scanned in full by every dashboard refresh | Cluster provisioned for peak and idle at night | Engineering capability assumed and not present | Capacity shared with BI users causing contention | Chosen for cost, then outgrown within eighteen months |
The decisive questions. How much data, growing how fast? How many concurrent dashboard users and how many analysts? Is the consumer primarily reports, or also models and agents? What does the business already pay Microsoft, Google or AWS? Who will operate it after handover? The last question eliminates more options than any technical criterion, and answering it honestly is what prevents a platform chosen for its elegance from being abandoned for its maintenance burden. Cloud Services & Migration and Cloud Cost Optimisation & FinOps are the adjacent services where the landing zone and the cost controls are set.
Modelling: The Decisions That Determine Whether It Works
Modelling choices are cheap to make early and expensive to reverse. Six are made deliberately on every build.
Star schema, not wide flat tables. A fact table at a declared grain surrounded by conformed dimensions. Wide denormalised tables are faster to write the first query against and impossible to keep consistent by the tenth.
Conformed dimensions. One customer, one product, one date, one org unit — used by every mart. This is the specific design decision that ends the monthly argument in Figure 2.
Slowly changing dimensions. Type 2 history for attributes that matter retrospectively (territory, price band, account owner), type 1 for those that do not. Deciding this after go-live means rebuilding history you no longer have.
Grain declared before aggregation. Every fact table states its grain in one sentence. Mixing grains in one table is the most common cause of a number that is subtly, confidently wrong.
Late-arriving facts handled explicitly. Credit notes, adjustments and backdated invoices arrive after the period closes. The model states whether they restate history or land in the current period — and the reporting layer must say which it is showing.
Identity resolution documented. How duplicate customers are detected and merged, what the survivorship rule is, and how a merge is reversed. Where this is left implicit, every downstream measure inherits the ambiguity.
Data Quality, Lineage and Observability
A warehouse without tests is a larger copy of the problem it was built to solve. Five controls are non-negotiable.
- Tests in the pipeline, not beside it. Volume against expectation, freshness against the schedule, uniqueness on declared keys, referential integrity across conformed dimensions, and accepted-value ranges. A failing test stops promotion rather than raising a ticket.
- Reconciliation as a test. Revenue, cost, headcount and inventory tie to the ledger or system of record every period, with a documented tolerance. This is the control that makes finance willing to retire its own extract.
- Quarantine, never silent drop. Rejected rows are stored with the reason, visible to the source owner, and reprocessable after a fix.
- Column-level lineage. Source field to semantic measure, so an unexpected number is traced in minutes. This is also the audit answer.
- Alerting to a person. Failed runs, late sources and reconciliation breaks reach a named owner with a runbook reference, not a dashboard nobody watches.
Transformations live in version control with code review and a deployment pipeline from development to test to production. A warehouse where changes are made directly in production has no history, no rollback and no author — and will be rebuilt within two years. DevOps & CI/CD Engineering Services is where that pipeline discipline comes from, and Backup, Disaster Recovery & Business Continuity covers the recovery side once the warehouse is a system of record.
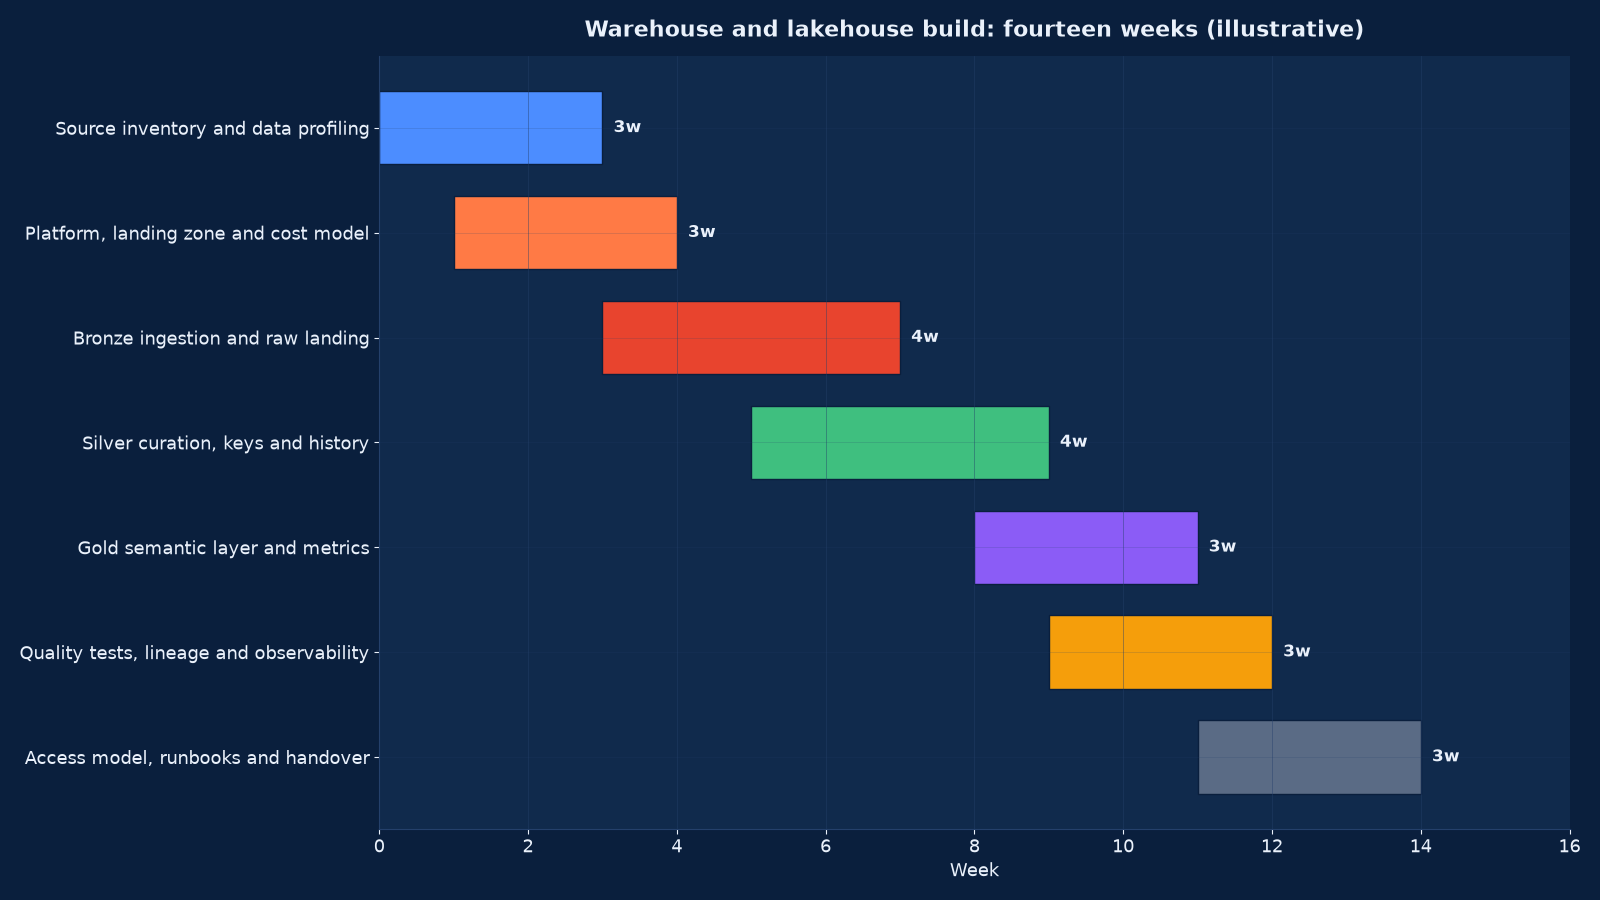
Chart values are an illustrative planning model based on typical UMC engagements and published industry benchmarks. They are not a guarantee of results on any specific project.
The Fourteen-Week Build
| Phase | Weeks | Activities | Output |
|---|---|---|---|
| Source inventory and profiling | 1–3 | Source register, extract routes, keys and identity, profiling results, reconciliation baseline | A source register with a data contract per source |
| Platform, landing zone and cost model | 2–4 | Platform decision with three-year cost model, accounts and networking, encryption, repository and pipeline scaffolding | A working environment with cost controls configured |
| Bronze ingestion | 4–7 | Immutable raw landing for each source, incremental and full-load patterns, checksums and load metadata | Every source landed and replayable |
| Silver curation | 6–9 | Cleansing, deduplication, conformed dimensions, type 2 history, rejection tables, key mapping | One version of each business entity |
| Gold semantic layer | 9–11 | Star-schema marts, metric views implementing the metric dictionary, aggregates for dashboard performance | Business-ready measures at declared grain |
| Quality, lineage and observability | 10–12 | Test suite, reconciliation jobs, lineage capture, alert routing and runbooks | Tests gating promotion; failures reaching a named owner |
| Access, documentation and handover | 12–14 | Role-based access, column masking, documentation, runbooks, owner training, parallel running and legacy retirement | A governed warehouse operated by the client |
Cost Engineering: Decided Before, Not Discovered After
Warehouse spend is almost always a design outcome rather than a usage outcome. Six levers are set at build time.
Partitioning and clustering on the columns queries actually filter by. An unpartitioned table scanned in full by a dashboard refreshing every fifteen minutes is the single most common cause of an unexpected bill.
Compute sizing and suspension. Auto-suspend or serverless for interactive work, reserved capacity only where utilisation justifies it, and separate compute for dashboards, analysts and pipelines so one workload cannot starve another.
Aggregates for dashboards. A pre-aggregated gold table serving a report is orders of magnitude cheaper than computing the aggregate on every refresh.
Refresh scheduling by need. Not every dataset needs to be current within the hour. Declaring latency per dataset is a design decision with a direct cost consequence.
Storage tiering and retention. Bronze data ages into cheaper storage; detail is retained per policy rather than indefinitely by default.
A named cost owner and a monthly review. Spend by workload, by team and by query pattern, reviewed monthly. This is exactly the FinOps cadence described in Cloud Cost Optimisation & FinOps, applied to the data platform; running the two together avoids the common situation where cloud cost is governed and the warehouse inside it is not.
Security, Access and Compliance
A warehouse concentrates the business’s sensitive data, so its security design is a board matter rather than an engineering detail.
Role-based access with least privilege. Roles map to job function, not to individuals; access is reviewed quarterly and removed by the joiner-mover-leaver process.
Column masking and row filtering. Salary, margin, personal and payment data are masked by default and revealed by exception, in the platform rather than in each report.
Encryption and key management. At rest and in transit, with customer-managed keys where the sector or a lender requires it.
Retention and deletion. Documented retention per layer, a deletion process that actually reaches backups and derived tables, and the evidence that it was executed.
Audit evidence. Who accessed what, when the model changed, who approved it, and how a reported number was derived. This is the pack an auditor, a regulator or a prospective acquirer will ask for, and assembling it after the fact is far more expensive than capturing it during the build. IT Audit, Compliance & ISO 27001 / SOC 2 Readiness and AI Governance, Risk & Compliance are the services where this evidence is formalised into certification and model-risk control.
Migration, Parallel Running and Cutover
The riskiest fortnight of the build is the one where the old and the new must agree. Four rules govern it.
- Reconcile before retiring. Every measure the legacy extract produced is reproduced by the warehouse for at least two closed periods, with differences explained line by line. Unexplained differences stop the cutover.
- Parallel running with a fixed end date. Long enough to cover a month-end and a quarter-end, short enough that people do not settle into maintaining both.
- Migrate the consumers, not just the data. Reports, scheduled exports, downstream applications and the person who maintains the workbook all need a cutover plan.
- Switch off on a named date. Legacy pipelines are disabled and their credentials revoked. A warehouse that coexists with the extracts it replaced has not replaced them.
Where the source system itself is being replaced at the same time, sequence the two: warehouse first, then the system change, so the reporting layer is stable while the source moves. Our CRM data migration process guide describes the cleansing, mapping and go-live control discipline that applies equally here.
Measuring the Build
These are baselined during profiling and reported weekly thereafter. The last three are the ones that distinguish a warehouse that is operated from one that merely exists.
| Measure | Definition | Target |
|---|---|---|
| Sources integrated | Count of registered sources landing on schedule | All in-scope sources by week seven |
| Reconciliation variance | Difference between warehouse and ledger per measure per period | Within documented tolerance, with exceptions explained |
| Analyst hours per new data request | Median effort from request to answer | Falls by two thirds against the Figure 2 baseline |
| Days to onboard a new source | From contract agreed to first production load | Under three days for a standard source |
| Hand-maintained pipelines | Transformations living outside version control | Zero |
| Duplicate definitions of a core metric | Distinct calculations in active use | One |
| Freshness attainment | Share of datasets refreshed within their declared latency | Above 99% |
| Pipeline failures detected before users | Share caught by monitoring | Above 95% |
| Cost per terabyte and per query | Warehouse spend against volume and usage | Modelled before build, variance under 15% |
| Legacy extracts retired | Count switched off on schedule | All by week fourteen |
Running This in an Indian Mid-Market Business
Conditions that recur in Indian businesses, and how each changes the build.
Tally, Busy or a sector ERP as the ledger. Often the authoritative source without an API, so extraction is a scheduled export with a defined format. The data contract matters more here than anywhere, because a silent change in the export breaks everything downstream.
GST, TDS and TCS as first-class data. Statutory returns are both a source and a reconciliation target. Building the warehouse so that invoiced revenue ties to GSTR-1 and GSTR-3B, and so that TDS deducted ties to Form 26AS, turns a monthly compliance scramble into a query.
Group structures and related parties. Multiple entities, intercompany trade and shared services mean consolidation and elimination must be modelled explicitly, not adjusted by hand each month.
Cost sensitivity and rupee-denominated budgets. Consumption-priced cloud services billed in dollars create exchange-rate exposure as well as usage exposure. Reserved capacity, region choice and aggressive refresh scheduling are usually worth more here than platform choice, and the three-year cost model is built in rupees with an explicit rate assumption.
Thin internal engineering. Where nobody will own a Databricks cluster, a fully managed warehouse with infrastructure-as-code and a documented runbook is the right answer even if it is not the most capable one. IT Staff Augmentation Services and Managed IT Infrastructure & IT AMC are how the operating gap is closed when the platform is already chosen.
Engagement Models
| Model | Duration | Deliverables | Best when |
|---|---|---|---|
| Data estate assessment | 2–4 weeks | Source register, profiling results, reconciliation baseline, platform recommendation with a three-year cost model | You know reporting is broken and need the business case |
| Full warehouse build | 14 weeks | Bronze, silver and gold layers, quality suite, lineage, access model, documentation and legacy retirement | The standard engagement |
| Lakehouse for mixed data | 12–18 weeks | Object-storage landing, table formats, streaming and batch ingestion, one platform for reporting and data science | High-volume event or semi-structured data alongside financial reporting |
| Semantic layer only | 4–6 weeks | Metric dictionary implemented over existing stores, with governance and version control | The data is adequate but the definitions are not |
| Platform migration | 12–20 weeks | Re-platforming with parallel running, reconciliation and cost comparison | Renewal, licensing change, acquisition or outgrown architecture |
| Warehouse operations retainer | Monthly | Pipeline monitoring, cost review, source onboarding, definition changes and quarterly access review | You want the platform operated rather than staffed |
What Good Looks Like After Fourteen Weeks
The build has worked when a new question is answered from the warehouse rather than around it.
- One source register exists, with a data contract and a named owner per source.
- Every business entity has one conformed definition, and history is queryable.
- Financial measures reconcile to the ledger every period, with documented tolerances.
- Tests gate promotion and failures reach a named person before a user sees a wrong number.
- Column-level lineage answers “how was this number produced?” in minutes.
- Warehouse cost is modelled, monitored and owned, with variance inside fifteen per cent.
- Access is role-based, sensitive columns are masked, and the audit evidence pack exists.
- The legacy extracts have been switched off and their credentials revoked.
- Somebody inside the business can onboard a new source without calling us.
Two follow-ons usually apply. Where the constraint is that nobody knows which measures matter, Unified Top-Level Business Management & Handling defines the operating layer the warehouse should serve. Where the objective is prediction rather than reporting, our predictive analytics service and Data Science Services for Business Analytics build on it — and our data science capability roadmap sets out the skills and roles the internal team needs if you intend to own it rather than retain it.
Frequently Asked Questions About Data Warehouse & Lakehouse Builds
Do we need a warehouse, or just better reports?
If two functions produce different numbers for the same measure, or if every new question needs a fresh manual extract, you need the governed layer rather than more reports. If you have two or three clean sources, one team and a narrow question set, a governed dataset inside the BI platform is enough and a warehouse is premature spend. The two-to-four-week assessment exists to answer this question with evidence rather than opinion.
How long does a build take?
Fourteen weeks for the full layered build including cutover and legacy retirement, twelve to eighteen where high-volume or streaming sources are involved. The determining factor is never the platform; it is how far your sources are from being reconcilable, and whether the business can name an owner for each metric definition.
What does it cost?
Two components: the build, and the run. The run is where surprises live, so we model three-year platform cost with your actual volumes before recommending anything, in rupees with an explicit exchange-rate assumption. For a mid-market business, consumption-priced warehouses typically cost less than a dedicated cluster at reporting-dominant workloads and more at continuous heavy compute — which is precisely why the workload question comes before the vendor question.
Snowflake, BigQuery, Redshift, Databricks or Fabric?
Whichever fits your workload, your existing cloud commitment and your ability to operate it. Snowflake and BigQuery carry the lowest operating burden for SQL-dominant reporting; Redshift suits established AWS estates; Databricks is right where machine learning and streaming dominate and engineering capability genuinely exists; Fabric consolidates a Microsoft estate under one capacity. The decisive question is usually who operates it after handover, not which has the better benchmark.
What is a lakehouse and do we need one?
A lakehouse gives warehouse semantics — transactions, schema enforcement, time travel — over cheap object storage. It is the right answer when you have mixed structured and semi-structured data and want one platform for reporting and data science. It is the wrong answer when your data is mostly structured, your team is small and your need is management reporting, because the curation work is identical and arrives later.
Can you integrate Tally, Busy or an ERP without an API?
Yes, by scheduled export with a defined format, checksums and a data contract that specifies notice of change. It is less elegant than an API and more fragile, so the contract and the monitoring matter more. Where the ERP is being replaced anyway, we usually build the warehouse first so that reporting is stable while the source moves.
How do you handle history we never captured?
You cannot recover what was overwritten. Where an operational system holds only current state, we start type 2 history from the cutover date and document that earlier history is unavailable — then check whether a legacy export, an archive or a report repository holds a usable snapshot. Being explicit about the boundary is better than back-filling with assumptions that will be quoted later as fact.
Will this reduce our cloud bill or increase it?
Initially it usually increases spend, because you are adding a platform while the old extracts still run. It reduces total cost once the legacy pipelines, duplicated stores and manual effort are retired — which only happens if cutover is enforced. Cost engineering at build time (partitioning, aggregates, suspension, refresh scheduling) determines whether the steady-state bill is proportionate; without it, warehouses grow expensive while usage stays flat.
Who owns the warehouse after handover?
A named internal owner, with a runbook, version control, a deployment pipeline and monitoring that alerts them. We train that person during weeks twelve to fourteen and hand over documentation rather than knowledge held in someone’s head. Where the business has no such person, an operations retainer or staff augmentation is the honest alternative — an unowned warehouse decays within a year.
How does this relate to AI and RAG work?
The warehouse is the structured foundation; retrieval-augmented generation needs governed, well-documented content and metadata on top of it. Running AI projects before the data layer exists produces demos rather than production systems, because the model inherits every definitional ambiguity the warehouse would have removed. Our data engineering for AI service covers that layer specifically.
What should we do first?
A two-to-four-week data estate assessment: source register, profiling, a reconciliation baseline against the ledger for three closed periods, and a platform recommendation with a three-year cost model. It tells you whether you need a warehouse, a semantic layer, or only the retirement of eleven spreadsheets — and it costs a fraction of the build.
Book a Data Estate Assessment
Send us the list of systems your reporting currently draws from and one month-end pack. In two to four weeks we will profile the sources, reconcile what can be reconciled, and give you a platform recommendation with a three-year cost model in rupees, a fourteen-week build plan, and an honest answer on whether you need a warehouse at all.
Contact Unified Management Consulting to arrange a confidential first conversation.
Related Services
Data warehouse and lakehouse builds are delivered alongside our other data and technology services:
- Data Science Services for Business Analytics — the analytical capability the warehouse exists to serve
- Data Engineering for AI: RAG & Knowledge Systems — the specialist variant where the consumer is a model
- Enterprise Systems Integration & Tech-Stack Consolidation — reducing the number of sources before integrating them
- Cloud Services & Migration (AWS, Azure, GCP) — the landing zone and networking the platform sits in
- Cloud Cost Optimisation & FinOps — the cost controls that keep the warehouse affordable
- DevOps & CI/CD Engineering Services — the pipeline discipline the transformations run under
- IT Audit, Compliance & ISO 27001 / SOC 2 Readiness — formalising the access and lineage evidence
- Backup, Disaster Recovery & Business Continuity — recovery once the warehouse is a system of record
- BI Dashboards & Executive Reporting — metric definitions, a governed semantic layer, three reporting tiers and the retirement of superseded spreadsheets
- Marketing Mix Modelling & Attribution — how much revenue each channel actually causes, with response curves validated against holdout tests
- Sales Analytics & Pipeline Intelligence — stage definitions, CRM hygiene, deal risk signals, three-way forecasting and a routed exception queue
- Predictive Analytics & Demand Forecasting — use case selection, naive baselines, walk-forward validation, prediction intervals and model operations