
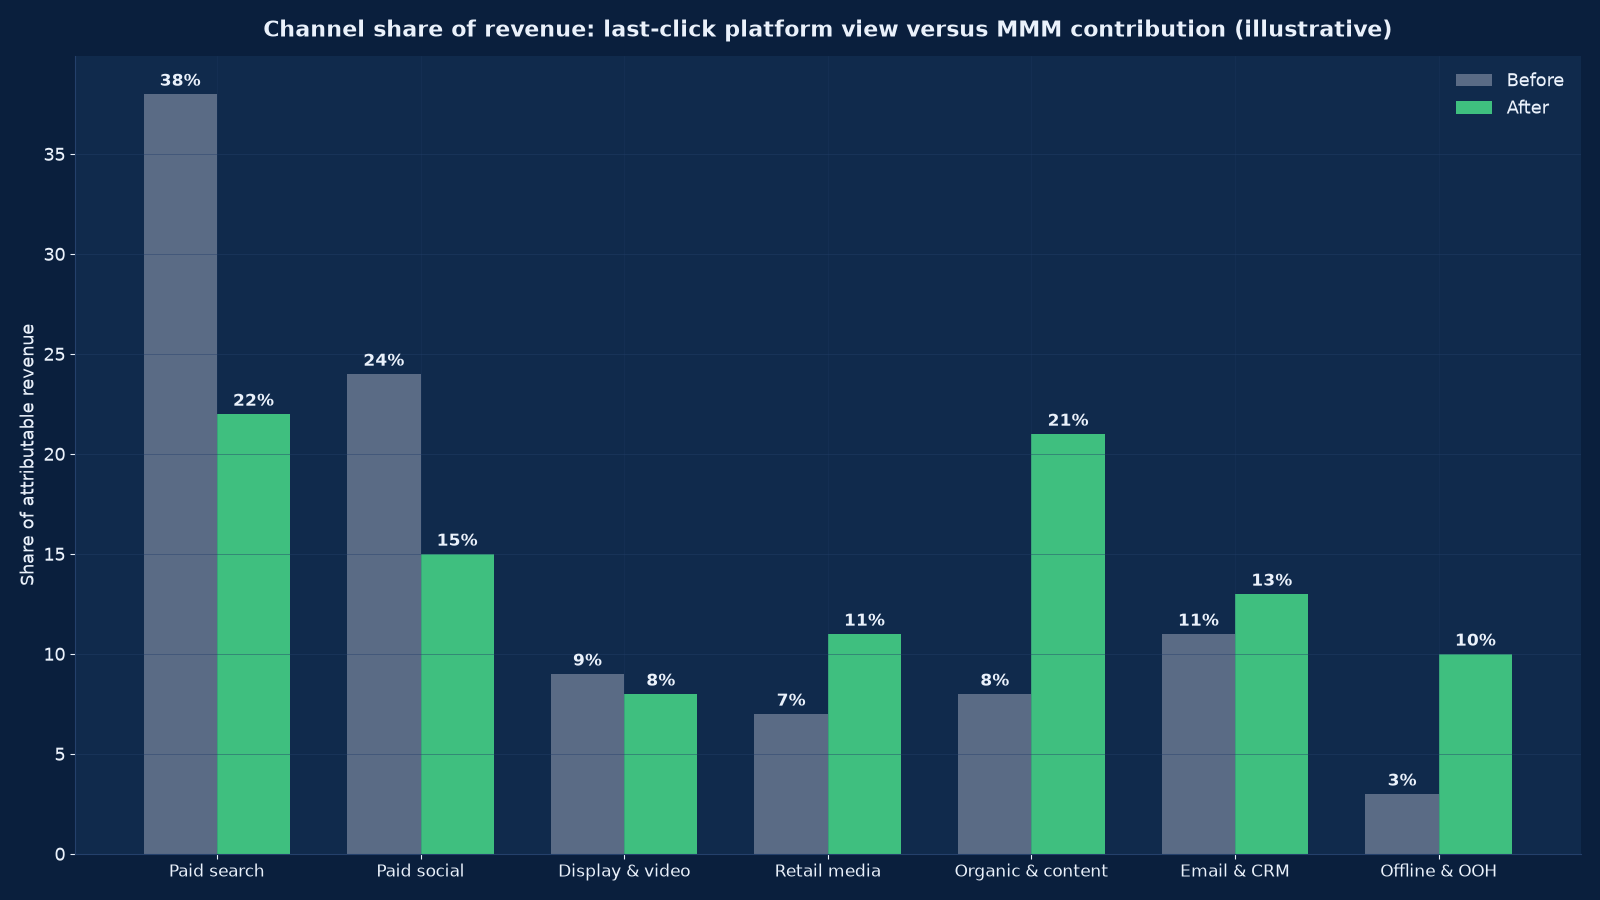
Chart values are an illustrative planning model based on typical UMC engagements and published industry benchmarks. They are not a guarantee of results on any specific project.
Last-click does not measure what caused the sale. It measures what was present when the sale happened — and those are different questions with different budget consequences.
Marketing mix modelling quantifies how much revenue each channel actually causes, separately from what your ad platform claims, and turns that into a defensible budget allocation with a saturation curve behind every rupee. Unified Management Consulting builds MMM as a governed analytical asset on your sales, spend, pricing, distribution and media data — validated against holdout tests, refreshed on a fixed cadence, and connected to the budget process rather than presented once and filed.
🎯 Marketing Mix Modelling & Attribution — Quick Summary
| Component | What We Deliver |
|---|---|
| What the model answers | How much revenue each channel caused, what the return is at current spend, where saturation begins, and what happens if budgets move. |
| Why not last-click | Platform attribution credits the final touch, ignores offline and upper funnel, and double-counts brand demand that would have arrived anyway. |
| Data we need | Weekly or daily sales by product and channel, spend by channel and campaign, pricing and promotion, distribution or inventory, seasonality, holidays, weather or macro where relevant. |
| Model structure | Adstock for carryover, saturation for diminishing returns, priors informed by tests, and controls for the non-media drivers that actually move sales. |
| Validation | Backtesting on held-out periods, calibration against geo holdouts or conversion lifts, and a naive baseline the model must beat. |
| Scenario layer | Budget reallocation under constraint, with the response curve shown so the trade-off is visible rather than asserted. |
| Refresh cadence | Quarterly refits, annual re-specification, and an immediate refit after any material market or mix change. |
| Governance | A named owner, version-controlled code, documented priors, and a rule that no budget moves on a single model run. |
| Relationship to tests | MMM sets the direction and the magnitude; incrementality tests settle the arguments the model cannot. |
This service is the analytical counterpart to Analytics & Attribution Services (GA4), which owns the event-level measurement layer, and it feeds directly into Global Advertising & Promotional Campaigns and OTT & Connected TV Advertising where the question is which channels deserve budget. The evidence discipline behind it is the same as in Market Research & Competitive Analysis.
Why Attribution Alone Cannot Allocate a Budget
The methods are not competitors; they measure different things at different resolutions. The failure mode is using a routing statistic to make a causal decision.
| Attribution method | What it measures | Where it fails |
|---|---|---|
| Last-click (platform default) | Which channel received the final interaction before conversion | It is a routing statistic, not a causal one. It systematically over-credits branded search and retargeting, and assigns zero to anything that cannot carry a click — television, radio, out-of-home, print, sponsorships, trade and word of mouth |
| Multi-touch (position or time decay) | A weighted share of credit across the observed journey | Only sees journeys it can observe. Offline and cross-device paths are invisible, and the weights are chosen by convention rather than estimated from outcomes |
| Data-driven attribution | Weights learned from observed conversion paths within one platform’s data | Still confined to that platform’s view, still click-based, and its model is not inspectable or reproducible |
| Marketing mix modelling | The causal contribution of each channel to sales, estimated from spend and outcome time series with non-media controls | Needs enough history and enough variation in spend; gives channel-level rather than campaign-level answers; slower to refresh |
| Geo holdout and conversion lift tests | Incrementality measured directly by turning a channel off in comparable markets | Expensive, disruptive, and only answers one question at a time — but it is the closest thing to ground truth and it is how an MMM is calibrated |
| Unified: MMM + tests + event data | Direction and magnitude from the model, calibration from tests, campaign detail from events | Requires the three layers to be reconciled deliberately, which is the work most organisations skip |
The practical consequence. A business that reallocates budget on last-click moves money from upper-funnel and offline channels into branded search and retargeting. Revenue holds for a quarter or two because it is harvesting demand that already existed, then falls when the pool stops being refilled. By then the spend data no longer contains the variation needed to detect what happened. Our guide to marketing attribution models sets out the model families; this service is what you do when choosing one is not enough.
What a Marketing Mix Model Actually Produces
Four outputs, each with a specific decision attached. A model that produces a report without these is not finished.
- Contribution by channel. How much of the period’s revenue each channel caused, with an uncertainty range — not a share of clicks, and not a point estimate presented as exact.
- Return on spend at current levels. Incremental revenue per rupee per channel, which is what makes channels comparable when their costs differ by an order of magnitude.
- Response curves with saturation. Where each channel’s return begins to fall, so a budget increase is assessed against the curve rather than against last quarter’s average.
- Decomposition of the period. How much of the result came from baseline demand, seasonality, price and promotion, distribution, and media — which is the output that prevents marketing being credited or blamed for the weather.
Figure 2 shows the second output for a representative mix. The ordering is the useful part: channels with a high claimed share of clicks frequently sit in the lower half of incremental return, and channels with no click at all frequently sit in the upper half.
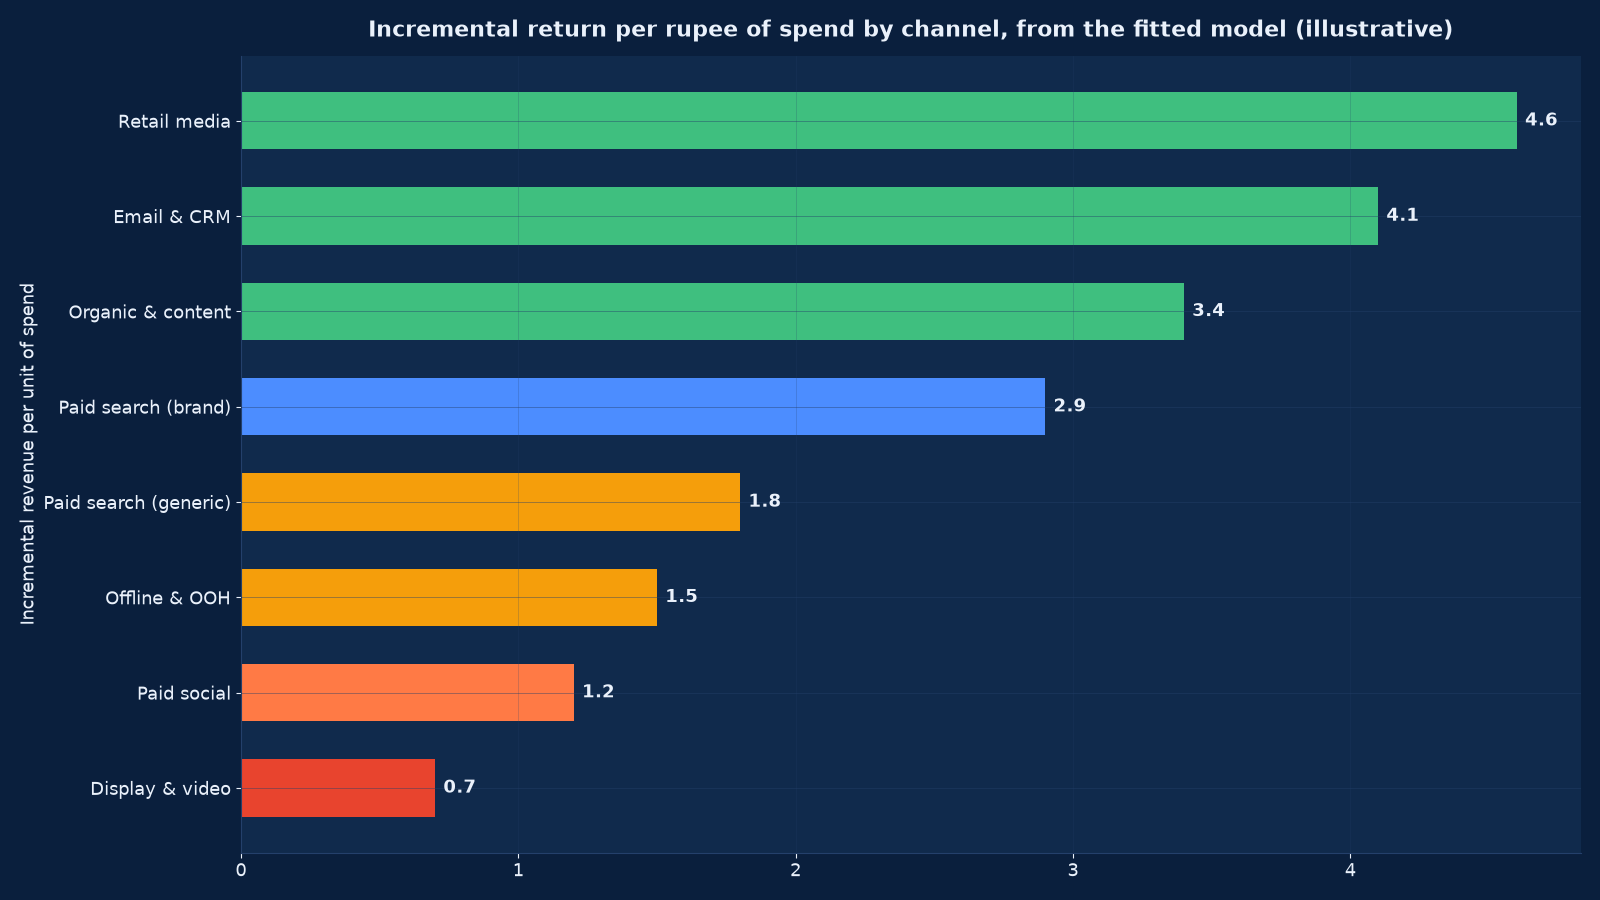
Chart values are an illustrative planning model based on typical UMC engagements and published industry benchmarks. They are not a guarantee of results on any specific project.
The Data a Model Needs
MMM is unforgiving about data availability and honest about it: with three years of clean weekly data across varied spend, the model is strong; with two years of monthly data and flat spend, it will produce wide ranges and should. This table is what we audit in weeks one to three.
| Data domain | What we need | Minimum | Common problem |
|---|---|---|---|
| Sales outcome | Revenue and units by week, split by product line, channel and geography where the business operates in more than one | Three years weekly, two at absolute minimum | Only monthly totals available, which removes most of the variation the model needs |
| Media spend | Spend by channel and, where possible, by campaign, with impressions or GRPs for reach-based channels | Weekly, matched to the sales period | Agency-reported spend differing from the ledger, and invoices lagging delivery by weeks |
| Pricing and promotion | List and realised price, discount depth, promotional calendar, competitor promotions where known | Weekly | Promotions recorded in a marketing calendar nobody maintains |
| Distribution and availability | Numeric and weighted distribution, stockouts, shelf or listing presence, marketplace availability | Weekly or monthly | Stockouts not recorded, so lost sales are attributed to weak demand |
| Non-media controls | Seasonality, holidays, school terms, weather where relevant, macro indicators, competitor entry, own new-product launches | As available | Omitted, so their effect is absorbed into whichever media term happens to correlate |
| Digital event data | Sessions, conversions, funnel steps, GA4 or equivalent, plus CRM pipeline for lead-driven models | Weekly aggregates are sufficient | Attribution-window changes mid-series that create a discontinuity nobody flagged |
The single most important condition is spend variation. A channel whose budget has not changed materially in three years cannot have its effect estimated — the model can only report that the data does not support a conclusion. Where that is the case, a controlled test is the answer, and we will say so rather than produce a confident number the data cannot support.
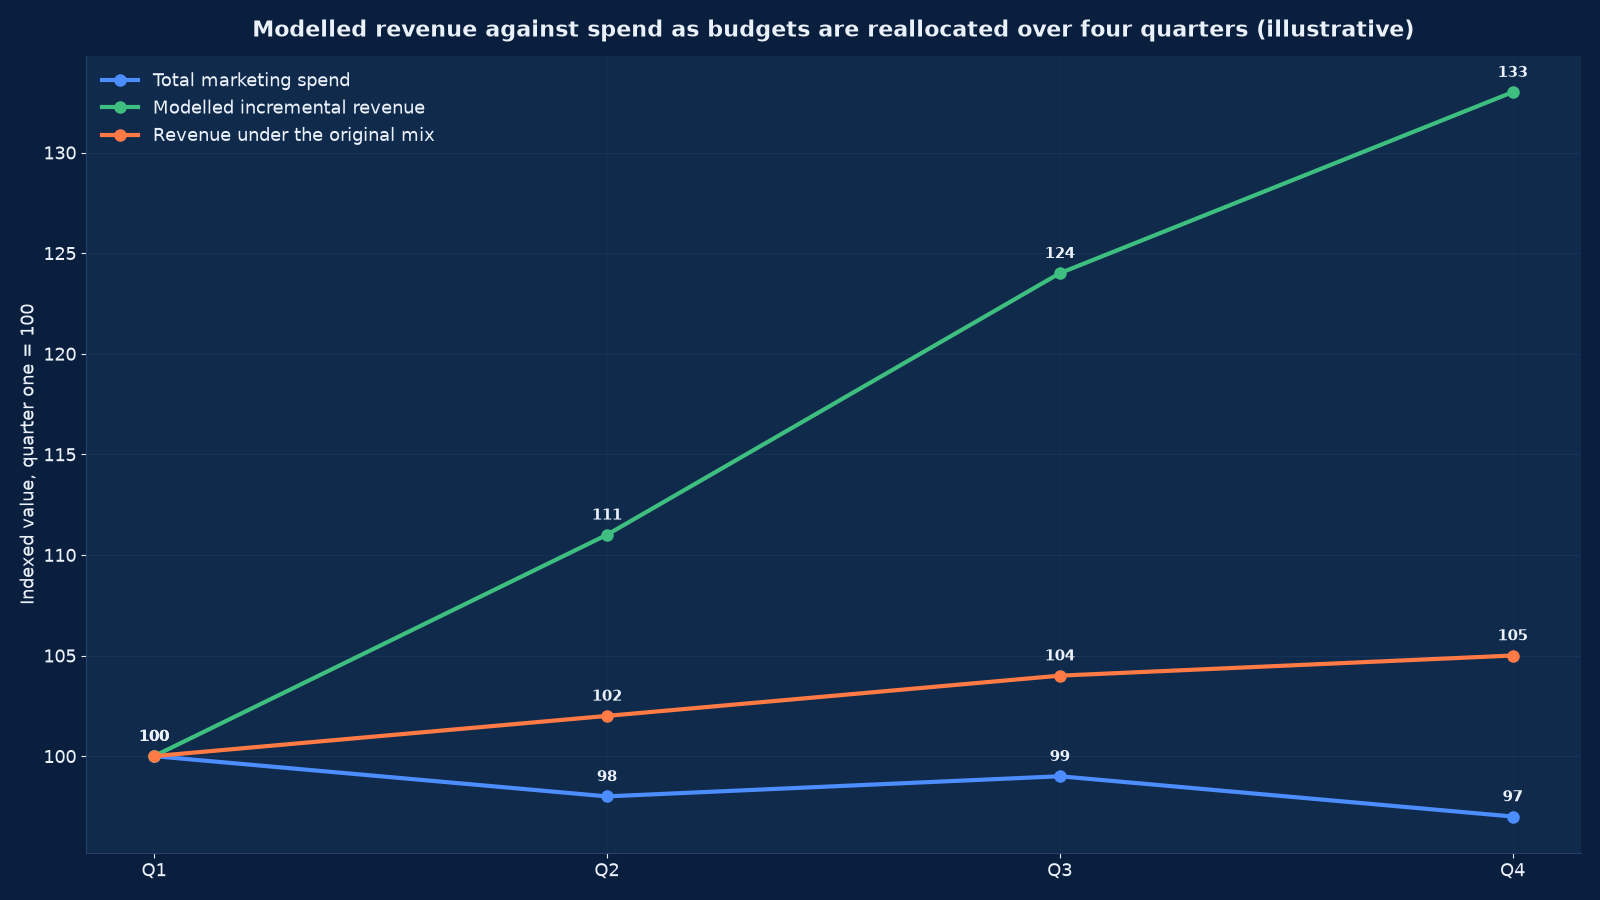
Chart values are an illustrative planning model based on typical UMC engagements and published industry benchmarks. They are not a guarantee of results on any specific project.
Model Structure: Adstock, Saturation and Priors
Three mechanisms distinguish a mix model from a regression of sales on spend, and getting them right is most of the craft.
Adstock (carryover). Advertising effects persist beyond the week of spend. Each channel has a decay rate — search decays in days, television and out-of-home over weeks, brand campaigns over months. Estimating decay per channel rather than assuming a common one changes both the contribution split and the recommended flighting pattern.
Saturation (diminishing returns). Response is concave: the hundredth rupee does less than the tenth. The curve is estimated per channel, and its shape determines whether a channel should be increased, held or cut. A model without saturation recommends spending everything on whichever channel has the highest average return, which is precisely wrong.
Priors. Where a channel has limited variation, the model is informed by prior ranges from tests, industry evidence or the business’s own history, and the prior is documented and reviewed. Undocumented priors are how a model becomes an instrument for confirming what somebody already believed.
Controls. Seasonality, holidays, price, promotion, distribution, competitor activity and macro variables enter the model explicitly. Their purpose is not prediction accuracy but attribution honesty: every unit of sales explained by a control is a unit not falsely credited to media.
Estimation. Bayesian hierarchical fitting is standard, because it produces the uncertainty ranges that make the output usable in a budget discussion and lets test results be incorporated as priors rather than argued about afterwards.
Validation: How a Model Earns the Right to Move Budget
An unvalidated mix model is a plausible story with numbers attached. Six checks are run before any recommendation is made, and the results are published alongside the recommendation.
| Validation | How it is run | What a pass looks like |
|---|---|---|
| Backtesting | Fit on the first N periods, predict the held-out periods, compare against actuals | Error inside the declared tolerance, and no systematic bias in either direction |
| Naive baseline comparison | Compare against seasonality-only and prior-period baselines | The model beats both; if it does not, it is not earning its complexity |
| Holdout calibration | A geo holdout or conversion-lift test on the largest disputed channel | Model contribution within the test’s confidence interval, or the model is re-specified |
| Sensitivity analysis | Re-run with alternative priors, saturation forms and control sets | The budget recommendation is stable; if it flips, the data does not support it |
| Residual review | Inspect residuals for structure, autocorrelation and unexplained periods | No pattern left that a known event would explain |
| Business review | Marketing, finance and sales review the contribution split against what they know happened | No channel is materially miscredited, or the disagreement is investigated not overridden |
The last check is the one most often skipped and the one that catches the most errors, because the people who ran the campaigns know which weeks were disrupted. Where a channel is disputed and the data cannot settle it, the answer is a test, not a louder model. Our Google Ads ROI guide describes the platform-side measurement that feeds this validation.
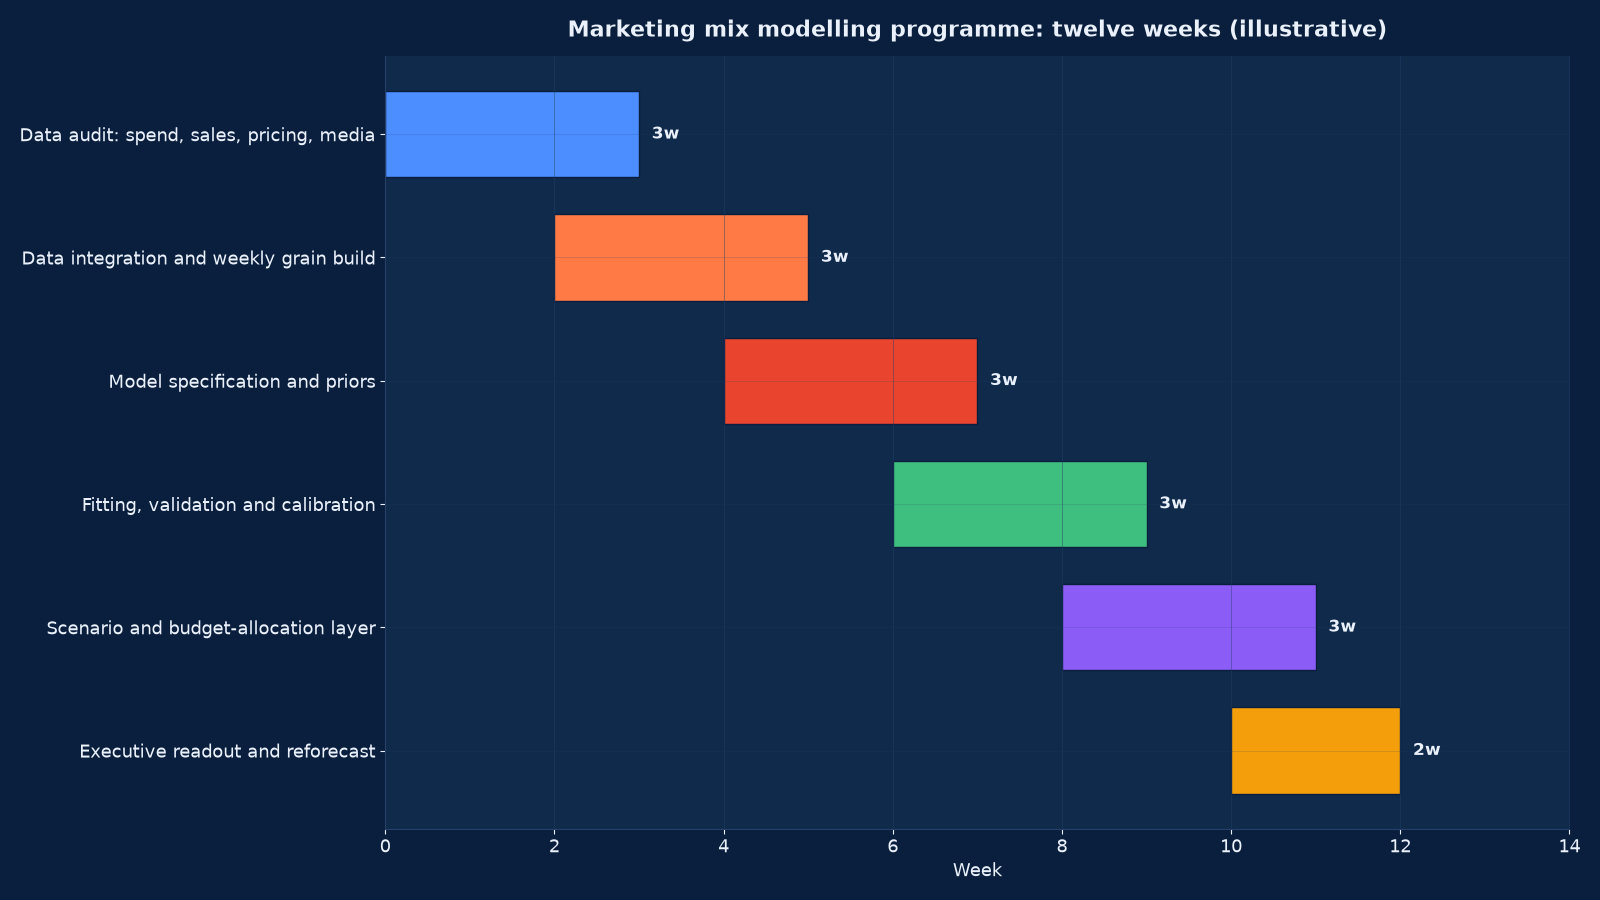
Chart values are an illustrative planning model based on typical UMC engagements and published industry benchmarks. They are not a guarantee of results on any specific project.
The Twelve-Week Programme
| Phase | Weeks | Activities | Output |
|---|---|---|---|
| Data audit and assembly | 1–3 | Spend reconciled to the ledger, sales assembled at weekly grain, price, promotion, distribution and controls collected, gaps documented | A modelled dataset with a written data-quality statement |
| Data integration | 3–5 | Automated weekly ingestion, one version of spend and sales, historic backfill, discontinuities flagged | A repeatable pipeline rather than a one-off extract |
| Specification and priors | 5–7 | Channel structure, adstock and saturation forms, control set, priors documented with their sources | A specification that can be reviewed before fitting |
| Fitting, validation and calibration | 7–9 | Bayesian fit, backtesting, baseline comparison, sensitivity runs, holdout calibration where available | A validated model with published uncertainty |
| Scenario and allocation layer | 9–11 | Response curves exposed, constrained reallocation optimisation, what-if interface for the budget owner | A usable planning tool, not only a report |
| Readout and reforecast | 11–12 | Executive presentation, budget recommendation with trade-offs shown, integration into the planning calendar and the reporting layer | An agreed allocation and a refresh schedule |
Where Mix Modelling Goes Wrong
| Failure mode | How it shows up | Prevention |
|---|---|---|
| Modelled once, never refreshed | A deck produced two years ago is still quoted; the market has moved and the numbers have not | Quarterly refit with a named owner and a standing agenda item |
| Confident point estimates | Contributions quoted to one decimal place with no range | Publish uncertainty; refuse to recommend on a channel whose range spans zero |
| Flat spend, forced conclusion | A channel whose budget has not changed in three years is given a precise return | Declare it unmeasurable and design a test instead |
| Media-only model | Price, promotion, distribution and seasonality omitted, so media absorbs their effects | Controls specified before fitting, with the decomposition published |
| Priors nobody can defend | A channel’s contribution matches what the agency claimed | Every prior documented with its source and reviewed by finance |
| No connection to the budget process | The model’s recommendation is noted and the previous allocation is approved unchanged | The scenario layer is used in the budget meeting, with the trade-off shown explicitly |
| Campaign-level over-reach | Channel-level estimates used to judge individual campaigns | State the resolution the model supports; use event data and tests below it |
| Agency conflict | The model is built or reviewed by the party whose budget it assesses | Independent ownership; we take no media commission and have no agency relationship |
From Model to Decision
The value is in the allocation, and allocation requires a governance rule rather than a recommendation.
Constrained optimisation. Budgets are reallocated subject to real constraints — total spend, minimum presence per market, contractual commitments, production capacity, and the practical limit on how fast a channel can absorb new spend. An unconstrained optimiser recommends putting everything into one channel, which is never executable.
Phased movement. Large reallocations are staged over two or three quarters so the effect is observable and reversible. Moving forty per cent of budget in one quarter destroys the variation you need to learn from the change.
Trade-offs shown, not asserted. Every recommendation is presented with what is given up: the response curve, the range, and the alternative allocations considered.
A decision rule. No budget moves on a single model run. Movement requires the refit to be stable across sensitivity runs, the finance owner to accept the contribution split, and any disputed channel to have a test scheduled.
This is the same decision-rights discipline as the operating-layer work in Unified Top-Level Business Management & Handling: an analytical output only changes a business when somebody is accountable for acting on it. Conversion Rate Optimisation is where the on-site half of the same question is worked, and Marketing Automation (HubSpot & Marketo) is where the owned-channel contribution the model finds is actually executed.
Running This in an Indian Market
Conditions that change the model rather than merely complicating it.
Offline still carries real weight. Print, radio, out-of-home, local cable, sponsorships, trade shows and dealer programmes cannot carry a click, so a click-based view assigns them zero. In most Indian consumer categories they are not zero, and the model is what makes their contribution visible for the first time.
Festival seasonality is structural. Diwali, Dussehra, regional new years, wedding seasons and harvest cycles produce demand variation larger than most media effects. Modelling them as controls rather than as noise is what prevents a festival period being credited to whichever channel happened to be running.
Dealer and distribution effects. Where sales run through distributors, sell-in and sell-out diverge, and availability moves results more than advertising does. Distribution enters the model explicitly, and the business decides which measure is the outcome — a decision that must be made before fitting, not after.
Marketplace and retail media. Amazon, Flipkart and quick-commerce platforms combine advertising, promotion and availability in one place, so their spend must be separated from their commercial terms or the model double-counts.
Data maturity. Spend is frequently recorded in three places — agency report, finance ledger and campaign platform — and they disagree. Reconciling spend to the ledger in weeks one to three is not housekeeping; it is the difference between a model and an opinion. Our enterprise rank-tracking review and our analytics tooling evaluation guide cover the equivalent reconciliation problem on the organic and AI-search side.
Engagement Models
| Model | Duration | Deliverables | Best when |
|---|---|---|---|
| Measurement diagnostic | 2–3 weeks | Audit of spend and sales data, assessment of whether an MMM is feasible, and a recommended measurement mix of model, tests and event data | You are not sure whether the data supports a model at all |
| Full MMM build | 12 weeks | Validated model, documented priors, scenario and allocation layer, executive readout and refresh schedule | The standard engagement where annual media spend is material |
| Incrementality testing programme | 6–10 weeks per test | Geo holdout or lift test design, execution, analysis and calibration of the existing view | One disputed channel needs settling with evidence |
| Model refresh and governance | Quarterly | Refit, validation, updated contribution and return by channel, standing review pack | The model exists and needs operating rather than rebuilding |
| Attribution layer alignment | 4–6 weeks | Reconciliation of GA4 or platform attribution against the model, with a documented rule for which measure governs which decision | Two measurement systems are producing contradictory advice |
| Budget planning workshop | 1 day plus preparation | Constrained reallocation run live with finance and marketing, with trade-offs shown | The annual or quarterly planning round |
Measuring the Programme
The eighth row is the one that matters. A model whose reallocation recommendations are followed and whose predicted outcomes then materialise is a model worth keeping; one whose predictions miss is re-specified or retired.
| Measure | Definition | Target |
|---|---|---|
| Modelled versus actual | Backtest error on held-out periods | Inside the declared tolerance with no systematic bias |
| Beats the naive baseline | Improvement over seasonality-only prediction | Yes, demonstrably |
| Spend reconciled to ledger | Share of media spend tied to finance records | 100% |
| Channels with estimable effects | Share of spend on channels with sufficient variation | Above 80%, or tests scheduled for the rest |
| Contribution stability | Variance in channel contribution across sensitivity runs | Recommendation unchanged |
| Incremental return by channel | Revenue per rupee at current spend | Measured, ranged and published |
| Budget moved on evidence | Share of reallocation traceable to the model or a test | Rising quarter on quarter |
| Reallocation outcome | Actual revenue against the modelled prediction after a move | Within range — the honest test of the model |
| Refresh adherence | Refits completed on schedule | Every quarter |
| Reports retired | Platform attribution reports withdrawn as budget inputs | Those that duplicate the model |
Frequently Asked Questions About Marketing Mix Modelling & Attribution
How much history do we need?
Three years of weekly data is comfortable, two years is workable, and under eighteen months usually is not — you need enough periods to separate seasonality from media effects and enough spend variation to estimate a response curve. Where history is short, we start with the controls and event data and add channels to the model as variation accumulates, rather than fitting a model the data cannot support.
Do we need to stop using GA4 or platform attribution?
No. They answer campaign-level and journey-level questions that an MMM cannot, and they feed the model with digital detail. What changes is which measure governs which decision: the model governs budget allocation between channels, event data governs campaign and creative optimisation inside a channel. Running both without an explicit rule is what produces contradictory advice.
How accurate is a mix model?
Channel-level contribution estimates typically carry a meaningful range, and that range should be published rather than hidden. Accuracy is sufficient to reverse a clearly wrong allocation and insufficient to justify moving five per cent between two similar channels — knowing which decision you are making is the point. Backtest error, sensitivity spread and holdout calibration are reported together so the confidence is visible.
Can MMM measure digital channels as well as offline?
Yes, and it often produces its most valuable findings there, because digital spend is where the claimed and the actual diverge most. The constraint is the same for every channel: sufficient variation in spend over time. A channel run at a constant budget for three years is not measurable by any statistical method, however good its platform reporting looks.
What does it cost?
The twelve-week build is a fixed fee based on the number of channels, markets and data domains, with quarterly refreshes priced separately. We take no media commission, have no agency relationship and hold no interest in any platform, so the recommendation is not influenced by who would benefit from it. Against annual media spend, the build is usually a small fraction of one quarter’s budget.
Will it tell us to cut a channel our agency loves?
It may, and if so it will show the response curve, the range and the trade-off rather than assert a conclusion. Where the evidence is genuinely ambiguous we say so and propose a holdout test to settle it. Independence is the reason to commission this externally: an agency assessing its own channels is not a measurement exercise.
How often should the model be refreshed?
Quarterly refits are standard, with an annual re-specification and an immediate refit after any material change — a new market, a price restructure, a competitor’s entry, a distribution change or a pandemic-scale shock. A model refreshed annually or less drifts into being a historical document, which is the most common way these programmes fail.
Can it handle lead-generation businesses as well as e-commerce?
Yes, with a different outcome variable. For lead-driven businesses the model predicts qualified pipeline or closed-won revenue rather than transactions, with longer adstock and a lag structure reflecting the sales cycle, and CRM data entering alongside media spend. The longer the cycle, the more history is needed — a nine-month B2B cycle usually requires four years.
How do you handle promotions and discounts?
As explicit controls, not as noise. Promotion depth, duration and frequency enter the model separately from media spend, so promotional lift is not credited to the advertising that happened to run alongside it. This is frequently the largest single correction in a consumer-goods model, and it is why price and promotion data is a hard requirement rather than a nice-to-have.
What if our spend data does not reconcile?
Then that is the first deliverable. We reconcile spend to the finance ledger in weeks one to three, document the differences, and refuse to fit a model over numbers finance will not stand behind. It is common to find agency-reported spend differing from invoiced spend by several per cent, production costs booked outside the media line, and commitments recorded in the period paid rather than the period flown.
What should we do first?
A two-to-three-week measurement diagnostic: audit spend and sales data availability, assess whether an MMM is feasible on your history, and recommend the mix of model, tests and event measurement. It costs little and prevents the most expensive mistake in this category, which is commissioning a model your data cannot support.
Commission a Measurement Diagnostic
Send us three years of weekly spend by channel and sales by product or market, plus your current attribution reports. In two to three weeks we will tell you whether a mix model is feasible on your data, what it would change about the current allocation, and where a test would settle a question the model cannot.
Contact Unified Management Consulting to arrange a confidential first conversation.
Related Services
Marketing mix modelling sits alongside our other measurement and marketing services:
- Analytics & Attribution Services (GA4) — the event-level measurement layer that feeds and complements the model
- Market Research & Competitive Analysis — the external evidence behind the controls and the priors
- Global Advertising & Promotional Campaigns — execution of the allocation the model recommends
- OTT & Connected TV Advertising Services — a channel whose contribution click-based attribution cannot see at all
- Conversion Rate Optimisation (CRO) — the on-site half of revenue per rupee of spend
- Data Science Services for Business Analytics — the modelling capability behind the refresh cadence
- Business Strategy Consulting — where a channel decision becomes a go-to-market decision
- BI Dashboards & Executive Reporting — metric definitions, a governed semantic layer, three reporting tiers and the retirement of superseded spreadsheets
- Data Warehouse & Lakehouse Build — source profiling, bronze-silver-gold layers, conformed dimensions, quality tests, lineage and cost engineering
- Sales Analytics & Pipeline Intelligence — stage definitions, CRM hygiene, deal risk signals, three-way forecasting and a routed exception queue
- Predictive Analytics & Demand Forecasting — use case selection, naive baselines, walk-forward validation, prediction intervals and model operations
- Media Planning & Buying — audience-first channel mix, negotiated rate cards, frequency and brand-safety controls, live pacing and an independent post-campaign audit
- Brand Performance & Creative Production — one narrative, a modular creative system, production economics, media-weighted testing and always-on optimisation