
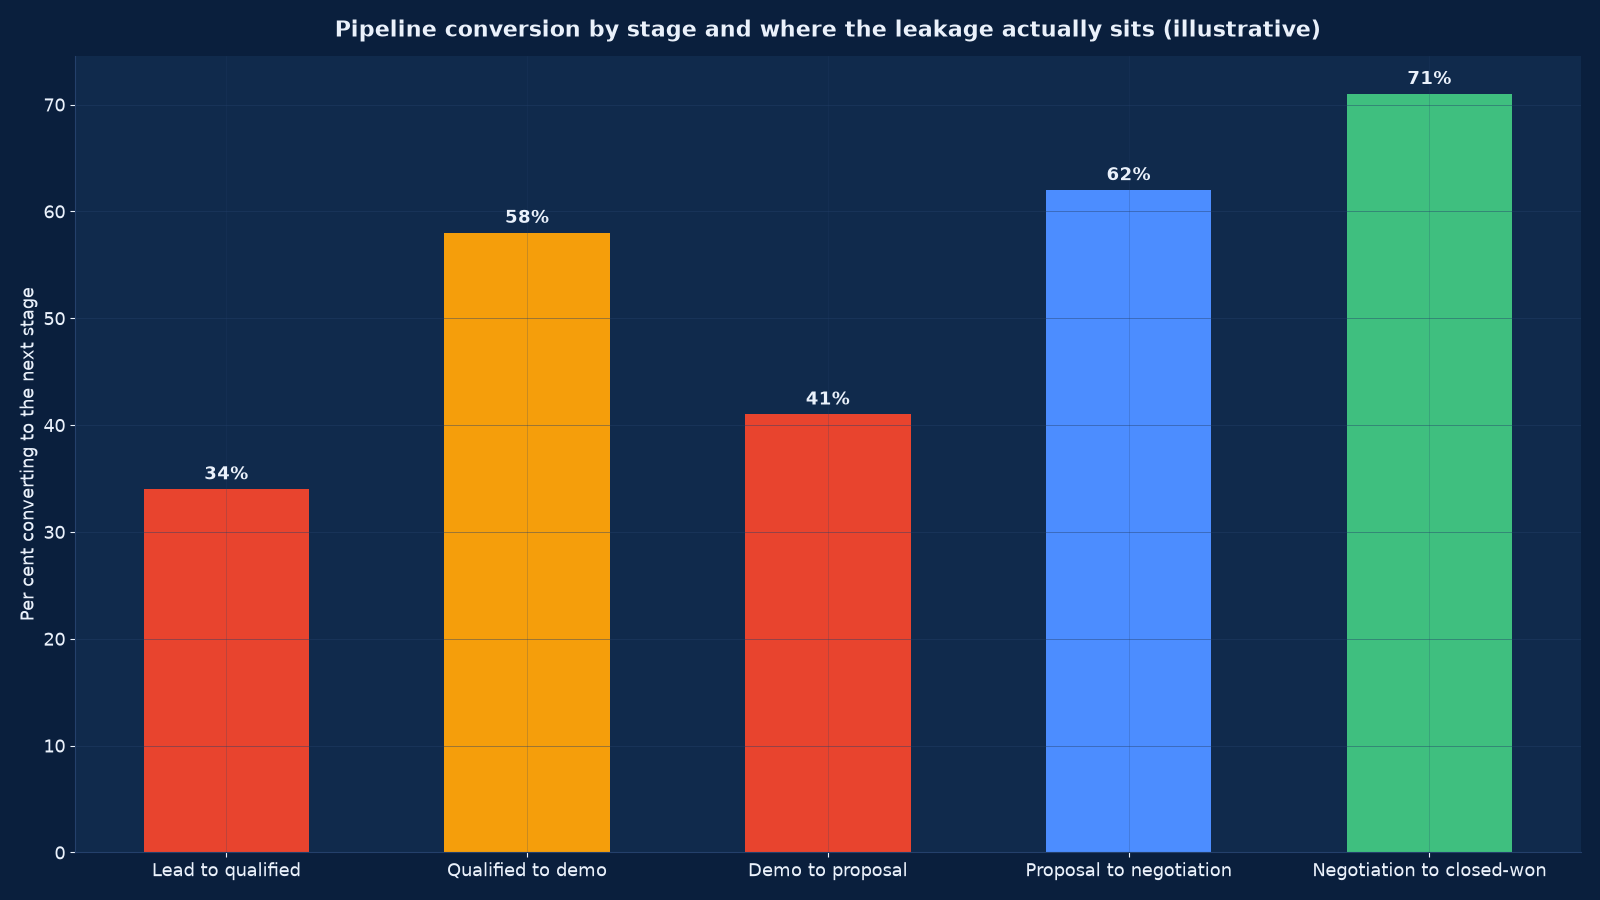
Chart values are an illustrative planning model based on typical UMC engagements and published industry benchmarks. They are not a guarantee of results on any specific project.
A pipeline is not a list of hopeful numbers. It is a queue of deals with an age, a stage, an owner and a probability — and once you can see those four things, the forecast stops being a negotiation.
Sales analytics and pipeline intelligence turns CRM data into a forecast you can commit to, a pipeline you can manage, and a set of routed actions your sales managers actually receive on Monday morning. Unified Management Consulting builds this on the CRM you already run — HubSpot, Salesforce, Zoho, Microsoft Dynamics or a custom build — starting from stage definitions and data hygiene rather than from dashboards, and ending with forecast accuracy measured against actuals every period.
📈 Sales Analytics & Pipeline Intelligence — Quick Summary
| Component | What We Deliver |
|---|---|
| Stage definitions first | Every stage with an entry criterion, an exit criterion and an owner, so a deal moves because something happened rather than because somebody is optimistic. |
| CRM data hygiene | Duplicate accounts, missing fields, stale deals and inconsistent product coding cleaned and then prevented by validation rather than by reminder. |
| Pipeline coverage | Coverage ratio by segment and by month, with the real stage-conversion maths behind the required top of funnel. |
| Deal ageing and slippage | Days in stage against the segment norm, slippage after commit, and the signals that predict both. |
| Forecast discipline | Weighted pipeline, category-based roll-up and a modelled forecast compared every period, with commit defined and enforced. |
| Win/loss analysis | Structured reason capture on every closed deal, analysed by segment, competitor and stage reached. |
| Rep and manager dashboards | A working view for the rep, a coaching view for the manager, and a coverage view for leadership — three different pages, one dataset. |
| Routed actions | Exceptions pushed to a named person with a due date, so intelligence produces activity rather than reporting. |
| Quota and capacity design | Territory potential, ramp time, attrition and coverage modelled, so the number is set from capacity rather than from ambition. |
This service is the analytical layer over Custom CRM Development & Integration Services and the natural next engagement after a CRM build, where the system exists but the numbers are not trusted. It draws its measurement discipline from Data Science Services for Business Analytics and its reporting layer from our BI dashboards service. Where revenue is falling short and the cause is unclear, the 30-Day Turnaround Diagnostic establishes the commercial position first.
Reporting Versus Intelligence
Most businesses have CRM reporting and believe they have sales analytics. The difference is whether the output changes what somebody does on Monday.
| Question leadership asks | What CRM reporting usually shows | What pipeline intelligence shows |
|---|---|---|
| Will we hit the quarter? | Open pipeline value, which is a sum of optimistic numbers | A forecast with a range, built from stage conversion and ageing rather than from rep self-assessment |
| Where is the pipeline weak? | Total value by owner | Coverage ratio by segment and month against the conversion required, showing which months are already unachievable |
| Which deals are actually at risk? | Close date and amount | Days in stage against the segment norm, engagement decay, stakeholder coverage gaps and slippage history |
| Why did we lose? | “Competitor” or “price” from a dropdown nobody completes accurately | Structured win/loss reason capture analysed by segment, competitor, stage reached and deal size |
| Are the reps busy or effective? | Activity counts | Activity correlated with stage progression and outcome, by segment and deal size |
| Is the quota achievable? | Last year plus a percentage | Territory potential, ramp, attrition and historical attainment distribution |
| What should change next quarter? | Nothing actionable | The two or three stage conversions or segments where a change moves the number most |
Every row in the third column is a measurement, not a view: it requires stage definitions to be agreed, data hygiene to be enforced, and a baseline of actual conversion to be established. That is why the first three weeks of the programme in Figure 3 are spent on definitions and data rather than on dashboards.
Stage Definitions: The Foundation Everything Rests On
Stage definitions are a management decision, not a CRM configuration. Each stage needs an entry criterion, an exit criterion, and an agreed treatment for the false positive that inflates it.
| Stage | Entry criterion | Exit criterion | What a false positive looks like |
|---|---|---|---|
| Lead | An identified contact with a plausible need, captured with source | Qualified against agreed criteria, or disqualified with a reason | Marketing-qualified labels applied by volume target rather than by criteria |
| Qualified opportunity | Budget, authority, need and timing established and recorded | A discovery or demo completed with the economic buyer or their delegate | A deal created to satisfy a coverage target, with no buyer identified |
| Solution validated | The buyer has seen the solution against their requirement | A proposal or quote requested by the buyer | A demo delivered to a champion who cannot buy, recorded as validated |
| Proposal issued | A priced proposal delivered to a named recipient | Commercial negotiation opened on terms, price or scope | A draft shared internally, or a proposal sent without a recipient |
| Negotiation | Terms, price, legal or procurement are actively in discussion | Verbal agreement to proceed, pending signature | “In procurement” used as a holding stage for stalled deals |
| Closed-won | A signed order or contract exists | — | A handshake, a purchase intent or a verbal commitment recorded as won |
| Closed-lost | The buyer declined, or the deal is abandoned against documented criteria | — | Deals left open past their close date to protect the coverage ratio |
Two rules that make the definitions hold. A deal moves stage because an event occurred and the event is recorded — not because the close date is near. And a deal cannot sit in a stage longer than the segment norm without an exception being raised to the manager. Without the second rule, ageing becomes invisible and the forecast becomes a list of deals that will close next quarter, forever.
CRM Data Hygiene
Pipeline intelligence over dirty CRM data produces confident nonsense faster than any other analytical mistake. Six defects account for most of it.
- Duplicate accounts and contacts. The same customer counted twice, with history split between records. Deduplicated with a survivorship rule, then prevented by matching at creation.
- Missing or defaulted fields. Amount, close date, product line, segment and source left blank or set to a default. Made mandatory at the stage where they become meaningful, not at every stage.
- Stale open deals. Opportunities past their close date kept open to protect coverage. Ageing and auto-review rules close or redate them with a recorded reason.
- Inconsistent product and pricing. Free-text product names and manual discount entry, which make margin-by-deal impossible. Constrained picklists and a price book.
- Close-date drift. Dates pushed forward repeatedly without a note. Slippage counted per deal and reported — it is one of the strongest available forecast signals.
- Activity recorded elsewhere. Calls, emails and meetings in personal inboxes and notebooks. Integration with email and calendar so activity is captured rather than reconstructed.
Hygiene is fixed once and then maintained by validation rules and by a weekly exception queue routed to the deal owner. It is never fixed by an exhortation to “keep the CRM up to date”. Our CRM data migration guide describes the cleansing and mapping discipline, and our manufacturing CRM guide shows how stage and data design differs by sector.
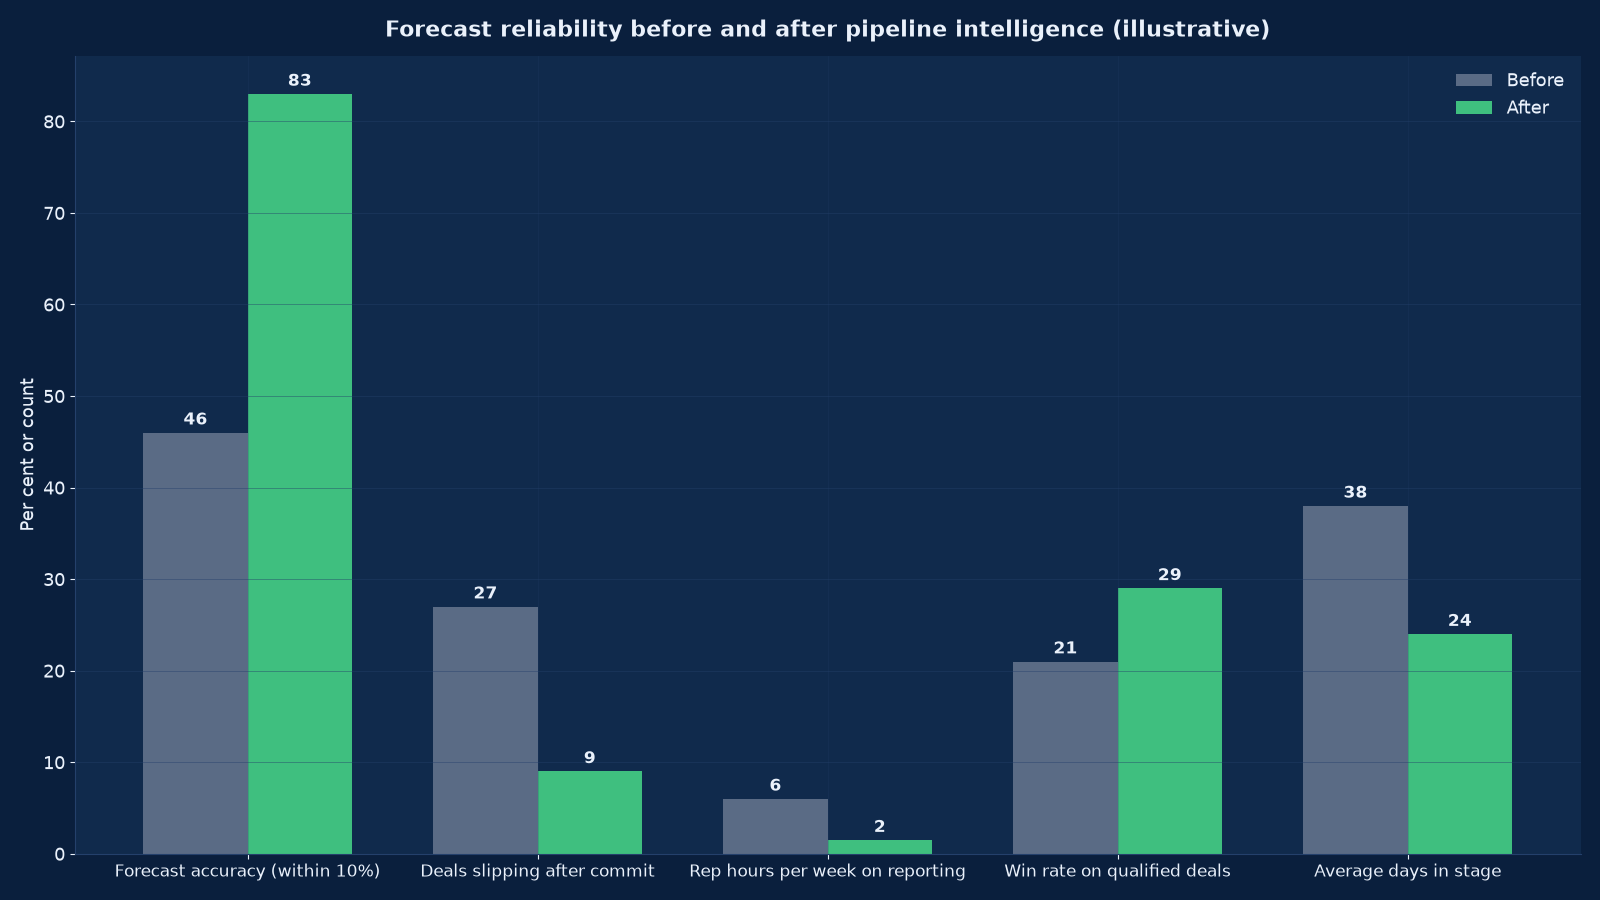
Chart values are an illustrative planning model based on typical UMC engagements and published industry benchmarks. They are not a guarantee of results on any specific project.
Forecasting: Methods and the Discipline That Makes Them Work
Method choice matters less than discipline. Businesses with simple weighted pipelines and enforced stage definitions out-forecast businesses with sophisticated models and negotiable stages.
| Method | How it works | Strength | Weakness |
|---|---|---|---|
| Rep commit roll-up | Each rep categorises deals as commit, best case or pipeline; the categories are summed | Fast, accountable, and it surfaces where a rep is unsure | Systematically optimistic, and it collapses when a rep is new or under pressure |
| Weighted pipeline | Deal value multiplied by a stage probability | Simple, transparent, consistent | The weights are usually convention rather than measurement, and it ignores deal age and size |
| Measured stage conversion | Probabilities estimated from your own history by segment, size and stage | Reflects how your business actually sells; improves as data accumulates | Needs enough closed deals per segment to be stable |
| Category-based forecasting | Deals grouped by risk category using age, engagement, stakeholder coverage and slippage | Detects risk that a stage label hides | Requires the underlying fields to be populated reliably |
| Modelled forecast | A statistical or machine-learning model over deal attributes and history | Best accuracy where volume justifies it, and it exposes the drivers | Opaque to the sales team unless explained, and it inherits every data defect |
| Blended, with a rule | Rep commit as the accountability layer, measured conversion as the sanity check, model as the tie-breaker | Combines judgement with evidence and makes disagreement visible | Requires a governance rule stating which layer wins, and who decides |
The governance we install. A fixed forecast calendar with a commit date; a defined meaning for commit, best case and pipeline; a slippage rule requiring a note whenever a close date moves; and a period-end review comparing forecast to actual by rep and by segment, with the variance published. Forecast accuracy becomes a measured management behaviour rather than an aspiration, and — importantly — a rep who forecasts conservatively and is right is treated better than one who is optimistic and wrong.
Deal-Level Risk Signals
Eight signals, each computable from fields a CRM already holds, that together predict slippage and loss better than any stage label. They are surfaced as a Monday exception queue rather than as a report.
| Signal | How it is measured | What it usually means |
|---|---|---|
| Days in stage versus segment norm | Age in the current stage compared with the median for that segment and size | A stalled deal; the most reliable single risk indicator available |
| Close-date slippage count | Number of times the close date has moved, and by how far | Optimism at creation, or a genuine delay the rep is reluctant to record |
| Engagement decay | Days since the last substantive customer interaction, by channel | Loss of champion, competing process, or a decision that has already been made elsewhere |
| Stakeholder coverage | Number and seniority of customer contacts engaged, against the deal’s complexity | A single-threaded deal, which is the most common structural cause of a late loss |
| Discount trajectory | Discount requested against the segment norm and against deal size | A deal being won on price, which predicts churn and margin problems later |
| Procurement and legal duration | Time in negotiation stage, split by procurement, legal and commercial | Where the real bottleneck sits, which is rarely the sales conversation |
| Competitor presence | Recorded competitor, analysed by win rate and by stage reached | Where you are being used as a reference price rather than genuinely evaluated |
| Champion change | Contact turnover on the account during the deal | A restart, whether or not the CRM stage reflects it |
How they are used. Each signal has a threshold set from your own history rather than from a generic rule. A deal breaching two or more thresholds goes to the manager’s queue with the specific reasons; a deal breaching none stays out of the way. This is the mechanism that converts analytics into management time used well — and it is why the programme delivers routed actions rather than dashboards alone.
Win/Loss Analysis: The Most Underrated Dataset in Sales
Every closed deal carries information, and almost no business captures it in a form that can be analysed.
Structured capture. A short, mandatory reason set at close: primary reason, secondary reason, stage reached, competitor if any, price position, and — for losses above a value threshold — a customer conversation conducted by someone other than the rep who lost it. The last point matters: reps record reasons that are survivable.
Analysis by segment, not in aggregate. An aggregate win rate hides the fact that you win seventy per cent in one segment and twenty per cent in another. Disaggregated by segment, deal size, competitor, source and stage reached, the same data tells you where to stop selling and where to sell harder.
Feeding it back. Win/loss findings change qualification criteria, targeting, pricing floors, proposal content and — occasionally — the decision to exit a segment. A win/loss dataset that only produces a quarterly slide has not been analysed.
Where the reasons cluster on price, the question is usually commercial rather than sales, and our cost rationalisation and margin recovery service in the turnaround category addresses the contribution side of the same problem. Where they cluster on capability, it is a product and positioning question for Business Strategy Consulting and Market Research & Competitive Analysis.
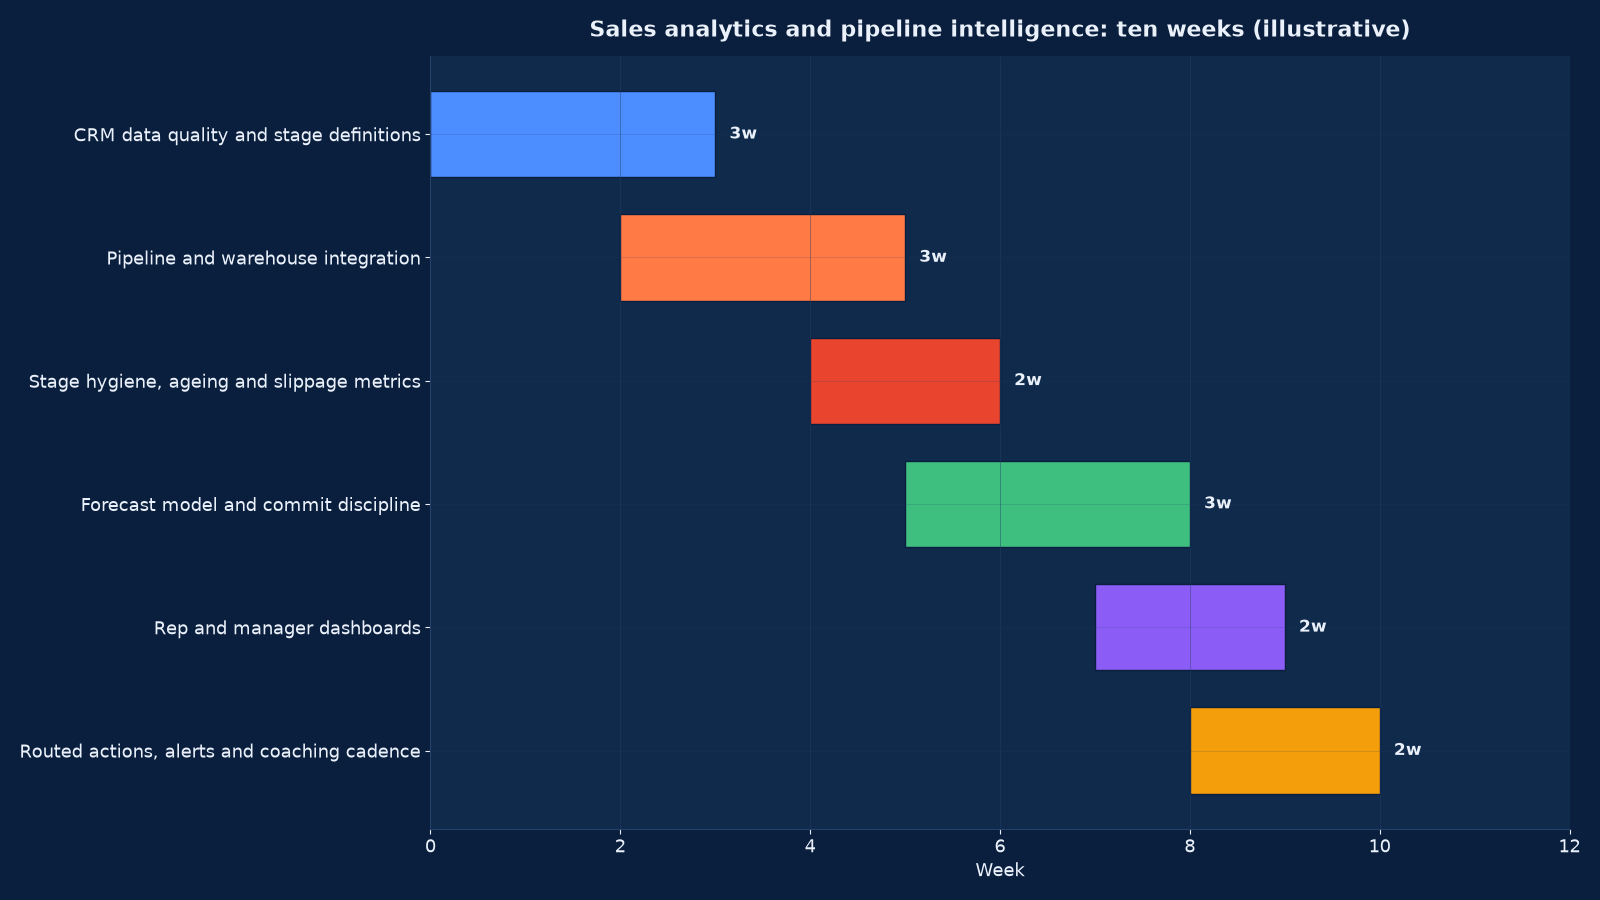
Chart values are an illustrative planning model based on typical UMC engagements and published industry benchmarks. They are not a guarantee of results on any specific project.
The Ten-Week Programme
| Phase | Weeks | Activities | Output |
|---|---|---|---|
| Stage definitions and CRM hygiene | 1–3 | Stage criteria agreed with sales leadership, duplicate and stale-record cleanup, mandatory fields, validation rules, baseline conversion measured | A stage definition document and a clean, constrained CRM |
| Integration and data model | 3–5 | Email, calendar, telephony and finance integration, deal and account model, history backfill, segment definitions | One reliable dataset spanning pipeline, activity and revenue |
| Ageing, slippage and risk metrics | 5–6 | Thresholds calibrated from history, exception rules defined, slippage tracking live | A computed risk score per deal with documented thresholds |
| Forecast model and commit discipline | 6–8 | Weighted, measured-conversion and category forecasts built, forecast calendar and commit rules agreed, variance reporting designed | A forecast produced three ways and compared every period |
| Rep and manager dashboards | 8–9 | Three views over one dataset: rep working view, manager coaching view, leadership coverage view | Published dashboards with routed exceptions |
| Actions, alerts and coaching cadence | 9–10 | Monday exception queue, alert routing, one-to-one agenda template, training and handover | A weekly operating rhythm owned by sales management |
Measuring the Programme
The first two rows are what the owner cares about; the last is what determines whether the rest survive the first quarter.
| Measure | Definition | Baseline and target |
|---|---|---|
| Forecast accuracy | Absolute variance between committed forecast and actual, per period | Baselined in week three; typically 40–50% before and 80–90% within ten |
| Deals slipping after commit | Share of committed deals not closing in the committed period | Falls by two thirds |
| Stage conversion by segment | Measured probability of progressing from each stage | Known and stable enough to forecast from |
| Pipeline coverage ratio | Open qualified pipeline against remaining target, by month | Above the ratio implied by measured conversion, not by convention |
| Average days in stage | Median by stage and segment, with exceptions flagged | Falling, with the outliers managed |
| Win rate on qualified deals | Closed-won as a share of qualified opportunities | Rising once qualification is enforced |
| Sales cycle length | Median days from qualified to closed-won, by segment and size | Measured, then reduced at the constraint stage |
| Rep hours on reporting | Time per rep per week assembling or updating reports | Falls from hours to under two |
| Discount discipline | Average discount against the segment norm and approval rate | Variance narrowing |
| Exception queue clearance | Share of routed exceptions actioned within the week | Above 85% — the adoption measure |
Every measure is baselined in week three from your own history so the improvement is a comparison rather than a claim. Where a measure cannot be baselined because the data does not exist, that is recorded as a finding: an unmeasurable sales process is the real problem, and the first three weeks are what make it measurable.
Quota, Territory and Capacity
A quota set without capacity modelling is a negotiation dressed as a plan, and pipeline analytics is what turns it into arithmetic.
Territory potential. Addressable accounts by segment and geography, with historical win rates and average deal size, giving a bottom-up potential per territory rather than a share of the company target.
Ramp and attrition. New reps take two to four quarters to reach full productivity and a share of the team leaves every year. Both reduce effective capacity, and ignoring them is the most common cause of an aggregate target that is individually impossible.
Coverage requirements. Working back from the target through measured stage conversion gives the qualified pipeline needed, and from there the marketing and outbound volume required. This is the number that makes a target credible or exposes it as aspiration.
Attainment distribution. If a quarter of the team achieves quota and three quarters do not, the quota is wrong or the territories are unequal — and the distribution tells you which. A healthy distribution is centred near quota with a tail above it.
This work belongs with the commercial planning cycle rather than after it, and it connects directly to Market Expansion Consulting where the question is which territories to enter, and to Unified Top-Level Business Management & Handling where the target-setting process itself needs governance.
Running This in an Indian Mid-Market Business
Conditions that recur, and how each changes the programme.
Relationship-led selling with thin documentation. Deals progress through personal relationships and are recorded after the fact, if at all. Stage definitions must reflect how the business actually sells — including a distinct stage for the informal commitment that precedes procurement — or the CRM will be bypassed entirely.
Field sales and dealer networks. Where revenue runs through distributors or a field force visiting outlets, sell-in and sell-out diverge and pipeline lives partly outside the CRM. Mobile-first capture, offline tolerance and a clear rule on which measure is forecast are design requirements, not enhancements.
Long government and PSU cycles. Tender-driven sales have procurement stages with fixed durations that no amount of sales effort compresses. Modelling them as a separate segment with its own conversion and cycle is the only way to produce a credible forecast.
Owner-led deal involvement. In many family businesses the promoter is the closing asset on large deals. That is a real capacity constraint and a real key-person risk, and both belong in the forecast model rather than being treated as exceptional. Risk, Governance & Business Continuity Support is where the key-person exposure is formally assessed.
Price sensitivity and payment terms as negotiating levers. Discount and credit terms are frequently conceded together, so win rate alone flatters the result. Margin and payment terms per deal are tracked alongside value — which is where Cash Flow & Working Capital Recovery and sales analytics meet, because a won deal on ninety-day terms has a cash cost that the pipeline never showed.
Engagement Models
| Model | Duration | Deliverables | Best when |
|---|---|---|---|
| Pipeline diagnostic | 2–3 weeks | Stage and data audit, measured conversion baseline, forecast variance analysis, prioritised fix list | The forecast is wrong and nobody knows why |
| Full ten-week programme | 10 weeks | Stage definitions, clean CRM, risk metrics, three-way forecast, three dashboards, routed exception queue | The standard engagement |
| Forecast rebuild only | 4–6 weeks | Forecast calendar, commit discipline, measured conversion, variance reporting | The data is adequate but the forecast is not credible |
| Win/loss programme | 4–6 weeks | Structured capture, third-party loss interviews, segment analysis and the changes it implies | You are losing deals and cannot say why |
| Quota and territory design | 3–5 weeks | Territory potential, ramp and attrition modelling, coverage requirements, attainment distribution analysis | The annual planning round, or a team restructure |
| Managed sales analytics | Monthly | Ownership of the exception queue, forecast calendar, variance reporting and quarterly threshold recalibration | You want the discipline maintained without the headcount |
What Good Looks Like After Ten Weeks
The programme has worked when the Monday sales meeting is shorter and better informed.
- Every stage has an entry and exit criterion that sales leadership agreed, and deals move because events occurred.
- The CRM is clean: no duplicate accounts, no stale open deals, no defaulted mandatory fields.
- Conversion by stage and segment is measured from your own history, and the forecast is produced three ways and compared.
- Forecast variance is published every period by rep and segment, and slippage requires a note.
- Risk signals generate a Monday exception queue routed to named managers with due dates.
- Win and loss reasons are captured structurally and analysed by segment, not in aggregate.
- Reps spend under two hours a week on reporting and managers spend their one-to-ones on the deals the queue surfaced.
- Quota and territory are derived from potential, ramp and attrition rather than from last year plus a percentage.
- Somebody inside the business owns the thresholds and recalibrates them quarterly.
Two follow-ons usually apply. Where the constraint is that marketing is not producing enough qualified pipeline, the coverage maths now proves it and the fix is demand generation and qualification criteria rather than sales effort. Where the constraint is that deals are won at unacceptable margin or terms, our cost rationalisation and margin recovery service addresses the pricing discipline side, and the CEO survey insights on cost pressure explains why that pressure makes discount discipline harder rather than easier. Our guide to using CRM data for smarter campaigns covers the marketing-side use of the same cleaned dataset.
Frequently Asked Questions About Sales Analytics & Pipeline Intelligence
Which CRM do you work with?
Any of them: HubSpot, Salesforce, Zoho, Microsoft Dynamics, Pipedrive or a custom build. The stage definitions, hygiene rules, risk signals and forecast discipline are CRM-independent, and the implementation differs only in where validation and routing are configured. If your CRM cannot support a requirement — usually a constrained picklist or a mandatory field at a specific stage — we will tell you that plainly rather than work around it in a spreadsheet.
Do we need to replace our CRM first?
Almost never. Most forecast failures are definitional and behavioural rather than technical, and a new CRM inherits the old habits unless the stages, hygiene rules and forecast governance are fixed first. Where the platform genuinely cannot enforce the rules, that becomes a scoped requirement for a custom build or reconfiguration — decided in week three with evidence, not assumed.
How quickly does forecast accuracy improve?
The baseline is measurable in week three and the discipline is live by week eight. Accuracy usually improves materially within one quarter and continues for two or three as conversion probabilities are re-estimated from your own accumulating history. The first improvement comes from enforcing stage definitions and closing stale deals, which costs nothing and is unpopular.
Our reps do not update the CRM. How do you fix that?
By making the CRM the only place the work is visible, and by removing the alternative. Three things do it: automatic capture of email, calendar and call activity so updating is not data entry; a Monday exception queue that names the deals needing attention, so updating has an immediate benefit; and retiring the parallel spreadsheet, so there is no second source to maintain. Exhortation and reminders have never worked.
Can this predict which deals we will win?
It can rank deals by risk and estimate a probability from your own conversion history, with a range. It cannot predict individual outcomes reliably, and any system claiming to should be asked for its backtest. The useful output is not a prediction but a routed action: these eight deals have breached two or more risk thresholds and need a manager’s attention this week.
How much deal volume do we need?
For measured stage conversion, roughly thirty to fifty closed deals per segment per year gives a stable estimate; below that we use pooled segments and wider ranges, and say so. For risk thresholds, a year of history is enough. A business closing twenty deals a year does not need a statistical forecast — it needs stage discipline, ageing visibility and a commit calendar, which is most of this programme at lower cost.
Will this add administration for the sales team?
It should reduce it. Rep reporting time typically falls from several hours a week to under two, because activity is captured automatically and the dashboards replace the spreadsheets reps maintained to defend their numbers. What does increase is discipline: a deal cannot sit in a stage past its norm without a note, and a close date cannot move without a reason.
How do you handle channel and dealer sales?
As a separate segment with its own stages, because sell-in and sell-out diverge and the buyer is an intermediary rather than an end customer. Where dealers hold stock, the pipeline must distinguish orders placed from orders sold through, or you forecast production against inventory that has not been consumed. Our sector CRM guides cover the manufacturing, distribution and retail variants of this problem.
Can it connect to our finance and delivery data?
It should. Linking won deals to invoiced revenue, margin, payment behaviour and delivery performance is what turns a sales report into a commercial one — and it is where the uncomfortable findings live, such as the segment with the highest win rate and the worst margin. This integration uses the same warehouse discipline as our data warehouse service.
How does this relate to marketing attribution?
Pipeline intelligence measures what happens after a lead arrives; attribution measures what caused it to arrive. Joining them closes the loop from spend to closed-won revenue by source, which is the only view that lets you allocate marketing budget on realised revenue rather than on lead volume. Our marketing mix modelling service is where that allocation decision is made properly.
What should we do first?
A two-to-three-week pipeline diagnostic: audit stage definitions and CRM data quality, measure actual conversion by stage and segment, and analyse forecast variance over the last four quarters. It costs little, requires no system change, and tells you whether your problem is data, discipline, coverage or quota — which are four different projects.
Book a Pipeline Diagnostic
Give us read access to your CRM and your last four quarters of forecast versus actual. In two to three weeks we will measure your real stage conversion, quantify your forecast error and its causes, and tell you whether the fix is data hygiene, stage discipline, coverage or the quota itself.
Contact Unified Management Consulting to arrange a confidential first conversation.
Related Services
Sales analytics and pipeline intelligence is delivered alongside our other commercial and data services:
- Custom CRM Development & Integration Services — the platform this layer sits on, and the usual preceding engagement
- Data Science Services for Business Analytics — the modelling capability behind measured conversion and forecast accuracy
- Market Research & Competitive Analysis — the segment and competitor evidence behind win/loss findings
- Business Strategy Consulting — where a segment finding becomes a go-to-market decision
- Market Expansion Consulting — territory potential applied to market entry
- Marketing Automation (HubSpot & Marketo) — the lead supply side of the coverage maths
- Cash Flow & Working Capital Recovery — where discount and payment terms conceded in the pipeline become a cash problem
- Cost Rationalisation & Margin Recovery — the margin discipline behind win rate
- BI Dashboards & Executive Reporting — metric definitions, a governed semantic layer, three reporting tiers and the retirement of superseded spreadsheets
- Data Warehouse & Lakehouse Build — source profiling, bronze-silver-gold layers, conformed dimensions, quality tests, lineage and cost engineering
- Marketing Mix Modelling & Attribution — how much revenue each channel actually causes, with response curves validated against holdout tests
- Predictive Analytics & Demand Forecasting — use case selection, naive baselines, walk-forward validation, prediction intervals and model operations