
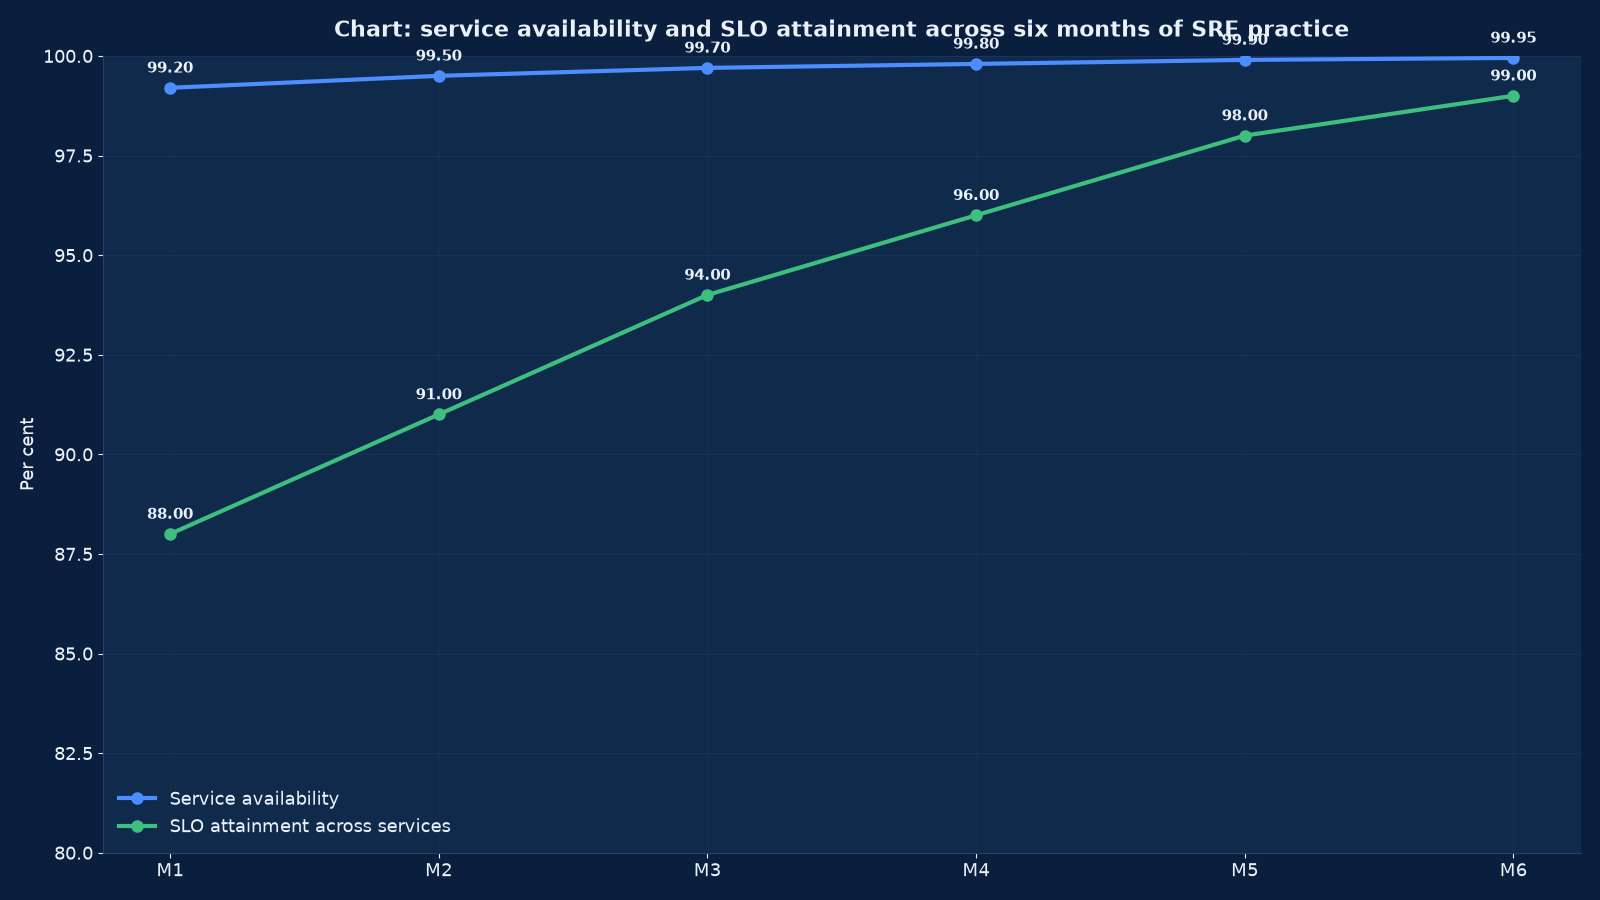
Chart values are an illustrative planning model based on typical UMC engagements and published industry benchmarks. They are not a guarantee of results on any specific project.
An outage is rarely a surprise to the system. It is a surprise to the people running it, because nobody had written down what “working” meant, nobody was measuring it, and the alert that would have given them forty minutes of warning was one of three hundred that week.
Site reliability engineering and observability at Unified Management Consulting is the practice of defining what a service should do, measuring whether it does, and organising people and releases around that measurement. It produces three things that are easy to name and hard to fake: service-level objectives your business agrees with, telemetry that answers a question in minutes rather than in a day, and an on-call model where the person paged can actually do something about it.
We are deliberately unromantic about SRE. It is not a job title you hire to make outages disappear, and it is not a monitoring product. It is an operating discipline: an inventory of services with named owners, objectives expressed as error budgets, instrumentation that supports those objectives, alerts that page only on user-visible impact, incident command that works under pressure, and a review process that changes the system afterwards. Where a team is small, the discipline is the same and the tooling is simpler — we would rather leave you with five dashboards somebody opens than fifty nobody does.
📈 SRE & Observability — Quick Summary
| Component | What We Deliver |
|---|---|
| Service inventory and ownership | Every user-facing and supporting service listed with a named owning team, a criticality tier, its dependencies and its business consequence of failure. |
| Service-level objectives | One availability and one latency objective per critical service, agreed with the business, with a measurement window and a written rationale for the number chosen. |
| Error budgets and release policy | The tolerated unreliability expressed as a budget, with a policy for what happens when it burns — including the freeze that makes the number meaningful. |
| Instrumentation | Metrics, structured logs and distributed traces implemented to a single contract across services, with health, readiness and business events instrumented deliberately. |
| Observability platform | Collection, storage, retention tiers and query tooling chosen for the questions you actually ask, and priced against the data volume those questions require. |
| Dashboards | One per critical journey, one per service and one for the platform, each with an owner and a stated purpose, retired when nobody opens them. |
| Alerting and routing | Symptom-based paging for user impact, cause-based ticketing for everything else, routing to the owning team, and a monthly review of every page. |
| On-call and escalation | A rota that is sustainable, escalation paths that are tested, runbooks per failure mode, and compensation and handover arrangements agreed in advance. |
| Incident command | Roles, decision rights, communication templates, severity definitions and a rehearsed process so that the first real incident is not the first rehearsal. |
| Capacity and load testing | Baseline load tests per critical journey, capacity headroom measured against real peaks, and scaling behaviour proven before it is needed. |
| Post-incident review | A blameless review within five working days producing changes with owners and dates, tracked to closure rather than recorded and forgotten. |
| Reliability reporting | A monthly report of SLO attainment, error budget burn, incident counts, restoration times and alert quality — readable by an operations head and a finance lead together. |
What Site Reliability Engineering Is — and What It Is Not
The term is used loosely enough that agreeing a definition is the first deliverable of most engagements. Below is the working definition we use, with the misconceptions we spend time removing.
| Element of the practice | What it means in delivery | What it is often mistaken for |
|---|---|---|
| Service-level objectives | A number the business agrees to, derived from what users need and what the architecture can deliver, measured on a defined window | A marketing figure quoted in a contract with no measurement behind it |
| Error budgets | The permitted unreliability inside the objective, spent deliberately on change and withheld when exhausted | A target to be maximised, which produces a team that stops releasing |
| Toil reduction | Manual, repetitive, automatable work identified and removed, with the reduction measured | Any operational work, including work that genuinely requires judgement |
| Blameless review | A structured examination of how the system allowed the failure, producing changes with owners | A post-mortem that names a person, after which nobody reports near misses again |
| Shared ownership with development | The team that builds the service carries a share of operating it, so reliability is a design input | A separate reliability team that inherits services and absorbs the consequences of their design |
| Observability | The ability to answer a new question about the system without deploying new code | Monitoring, which answers the questions you thought to ask in advance |
| Progressive delivery | Changes released to a subset first, observed against the objective, then rolled forward or back automatically | A deployment window, which is a schedule rather than a control |
| Capacity management | Headroom measured against real peaks with a forecast and a scaling plan | Adding capacity reactively after an incident, which is expensive and often too late |
If your organisation wants reliability without any of these — no objectives, no reviews, no shared ownership — then what it wants is better monitoring and faster incident response. That is a legitimate and much cheaper goal, and we will scope it honestly rather than sell you a practice you will not operate.
Service Inventory and Ownership: The Prerequisite
Nothing in this discipline works before the inventory exists. Estates cannot state how many services they run, which are user-facing, who owns each, or what happens to revenue or patient care when one fails. Producing that list is usually the first two weeks of an engagement and is the artefact every later decision refers back to.
| Inventory field | Why it is needed | How it is populated |
|---|---|---|
| Service name and description | A shared vocabulary; most reliability arguments are actually naming arguments | From the owning team, not from the deployment manifest |
| Owning team and named individual | Alert routing, escalation and accountability | Agreed with the technology head; services without an owner are candidates for retirement |
| Criticality tier | Determines the objective, the on-call treatment and the investment in redundancy | Assessed against business consequence, not against how much somebody likes the service |
| User-facing journeys served | Objectives are set on journeys users experience, not on internal components | Mapped with the business: order to payment, enquiry to response, login to record |
| Dependencies | Upstream and downstream services, databases, queues, third parties, and the failure behaviour of each | From traces where they exist, from code and configuration review where they do not |
| Deployment and runtime | Where it runs, how it is deployed, and how it is rolled back | From the pipeline and the platform; gaps here are recorded as risks |
| Existing telemetry | What is already measured, retained for how long, and whether it answers a question | Audited before new instrumentation is specified, to avoid duplicating what exists |
| Historical incidents | What has actually gone wrong, how often, and how long restoration took | From ticket history and memory, with the memory part gathered in interviews |
| Cost and volume | Request volume, storage and compute cost, which drive both capacity and telemetry budget | From billing allocation and platform metrics |
| Retirement candidate | Services nobody can explain are usually services nobody uses | Flagged for the estate review; retiring a service is the most reliable improvement available |
The inventory is also the input to consolidation decisions. Where the same capability is served by three implementations, reliability work triples for no benefit, and the argument in tech stack consolidation applies directly: fewer services means fewer objectives, fewer dashboards and fewer people on call.
Service-Level Objectives, Indicators and Error Budgets
An objective is a promise with a measurement attached. Choosing the number is a business decision informed by engineering reality; choosing the indicator is an engineering decision informed by what users experience. Getting either wrong produces a metric that everybody quotes and nobody trusts.
| Service class | Availability objective | Latency objective | Rationale and window |
|---|---|---|---|
| Customer-facing transactional | 99.9 per cent monthly | 95 per cent of requests under 400 milliseconds, 99 per cent under 1 second | Direct revenue or service delivery impact; measured monthly so a budget is meaningful within the period |
| Customer-facing informational | 99.5 per cent monthly | 95 per cent of requests under 1 second | Degradation is visible but rarely stops a transaction; a lower objective frees budget for change |
| Internal business application | 99.5 per cent within business hours, 99 per cent overall | 95 per cent of requests under 1 second | Out-of-hours failure costs almost nothing; an objective that ignores this wastes money on redundancy nobody needs |
| Batch and reporting | 99 per cent of scheduled runs completing inside the window | Completion inside the agreed window, not per-request latency | Timeliness is the service the business consumes, so the objective measures timeliness |
| Integration and API | 99.9 per cent monthly | 95 per cent of calls under 500 milliseconds, with an agreed rate limit | A partner’s objective becomes yours the moment you sign the contract |
| Data and analytics platform | 99 per cent monthly, with a stated recovery point | Query completion inside an agreed percentile | Durability and recoverability matter more than uptime for analytical workloads |
- Indicators are chosen from the client’s side of the interaction wherever possible: successful responses served, not process uptime, which can be perfect while the service is broken.
- Every objective has a measurement window and a data source named in the same sentence, because an objective without them is an aspiration.
- Error budgets are the difference between 100 per cent and the objective, expressed in minutes and in permitted failed requests.
- Burn-rate alerts fire on the rate of consumption, not on the level, so a fast burn pages and a slow burn raises a ticket.
- When a budget is exhausted the agreed consequence applies — typically a freeze on non-critical releases until reliability work restores it. A budget with no consequence is a report.
Instrumentation: Metrics, Logs and Traces
Three signals, one contract. The contract is what makes an estate observable rather than merely instrumented: the same labels, the same request identifier, the same log format and the same health semantics in every service, so that a question can be asked once and answered across the whole estate.
| Signal | What we instrument | Contract applied across services | Common gap we find |
|---|---|---|---|
| Metrics | Request rate, error rate and latency histograms per endpoint; saturation of CPU, memory, connections and queues; business events such as orders or submissions | Consistent label names, cardinality limits agreed in advance, and a rule against labels whose values are unbounded | Averages instead of histograms, which hides the tail that users experience |
| Logs | Structured application logs with severity, request identifier, user or tenant reference where lawful, and error context; access logs; platform and audit logs | One JSON schema, one timestamp format, one correlation identifier propagated across service boundaries | Logs written as prose, so answering a question means reading them |
| Traces | Spans across HTTP calls, queue publishes and consumes, database queries and third-party calls, with adaptive sampling | Trace context propagated in a standard header, error spans always captured regardless of sampling | Tracing in the application tier only, so the slow database call is invisible |
| Health and readiness | Liveness and readiness probes that test real dependencies rather than process existence | A documented definition of ready, and a startup grace period that reflects reality | A readiness probe that returns healthy while the service cannot reach its database |
| Synthetic checks | Critical journeys exercised from outside on a schedule, with results feeding the objective | One check per critical journey, run from more than one location where users are distributed | Objectives measured only from inside the system, so a DNS or CDN failure is invisible |
| Business signals | Conversion, submission and completion events tied to the journey the objective describes | Defined with the business, stored alongside technical metrics so a technical change can be compared with a business outcome | Technical dashboards that stay green while revenue quietly falls |
Instrumentation is delivered through the golden path wherever a platform exists, so a new service arrives already observable. Retrofitting forty services is a project; instrumenting one template is an afternoon, which is why we work with DevOps & CI/CD Engineering on the pipeline side of this.
Dashboards That Somebody Opens
A dashboard is a hypothesis about what someone needs to see. We build four kinds, each with a named owner, and we delete the rest. The quarterly review asks one question per dashboard: has anybody opened this since we last looked?
| Dashboard | Audience | Content | Test of usefulness |
|---|---|---|---|
| Journey dashboard | Service owner and on-call engineer during an incident | Objective attainment, error budget burn, request volume, error rate and latency percentiles for one user journey, with dependencies beneath | During an incident it is opened first and answers ‘is it broken and how badly’ in under a minute |
| Service dashboard | Owning team, weekly | Deployment markers against the objective, saturation, dependency health, and the errors that did not become incidents | The team can explain every movement in the last week without running a query |
| Platform dashboard | Platform or infrastructure team | Cluster and node health, capacity headroom, upgrade status, policy refusals, and cost against budget | Capacity problems appear here before they appear on a journey dashboard |
| Executive reliability summary | Technology head, monthly | Objective attainment per critical service, incidents and restoration times, error budget position, and the trend of alert quality | It fits on one screen and requires no explanation from an engineer |
| Change and release view | Release manager | Deployments, feature flags, configuration changes and infrastructure changes on one timeline against incident markers | The first question in any review — ‘what changed?’ — is answered by looking at it |
| Cost and volume view | Cost owner | Telemetry volume and cost per service, retention in use, and the queries consuming the most | An unexpected telemetry bill is explained before finance asks |
We are equally willing to remove dashboards. Estates commonly hold several hundred panels built during incidents and never revisited, which slow the tool down and train people to ignore the ones that matter.
Alerting: Page Only When a Human Can Act
Alert design is where most reliability programmes succeed or fail, and it is the cheapest part to fix. The rule we apply is uncompromising: a page must mean that a human needs to do something now. Everything else is a ticket, a dashboard or nothing at all. Figure 2 shows what happens to the on-call experience when that rule is enforced.
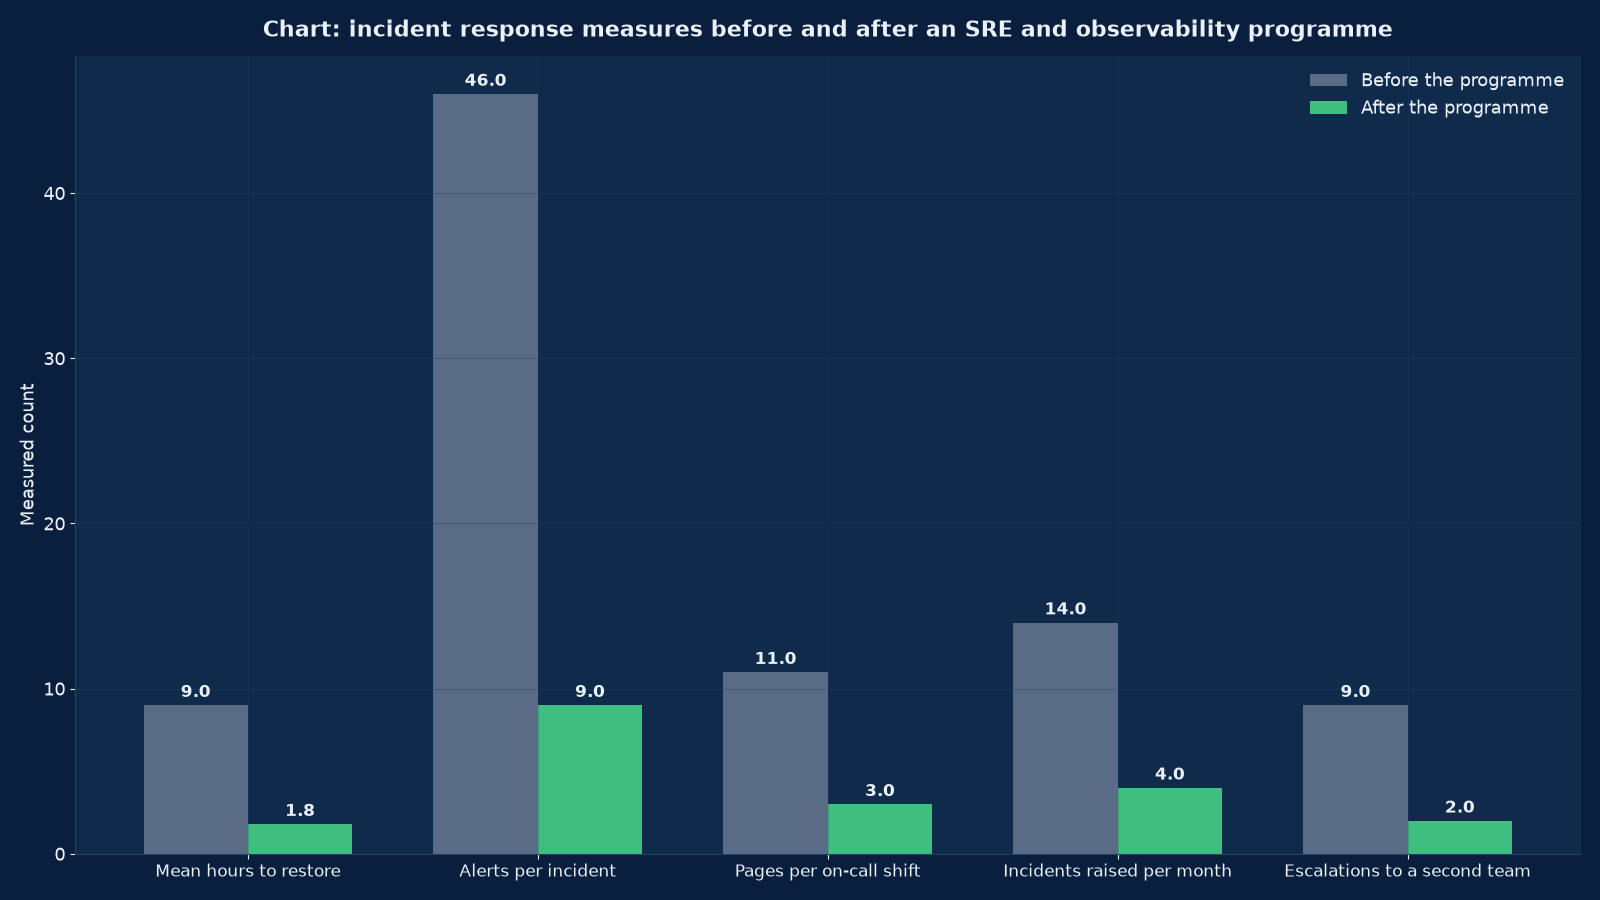
Chart values are an illustrative planning model based on typical UMC engagements and published industry benchmarks. They are not a guarantee of results on any specific project.
| Alert class | Trigger | Route | Why |
|---|---|---|---|
| Error budget burn, fast | A burn rate that would exhaust the remaining budget inside an hour | Page the owning team immediately, escalate after fifteen minutes without acknowledgement | User impact is happening now and will continue; this is the alert that justifies on-call |
| Error budget burn, slow | A burn rate that would exhaust the budget inside the window | Raise a ticket for the owning team, surfaced on the weekly review | Real degradation that does not need somebody woken up |
| Journey failure | A synthetic check failing from two or more locations | Page the owning team, with the platform team copied | Confirms impact from outside the system, which internal metrics can miss |
| Saturation forecast | Disk, connection pool, queue depth or memory trending to exhaustion within a defined period | Ticket, escalating to a page if the trend continues past the intervention point | These are the incidents that can be prevented with an hour of warning |
| Deployment regression | Objective breach within the observation window after a release | Automatic rollback plus a page to the releasing team | The fastest restoration available is usually undoing the change |
| Platform health | Node loss, control plane degradation, certificate expiry, backup failure, upgrade failure | Page the platform team; backup failures escalate to the technology head | A failed backup is a silent loss of the recovery option, which is why it pages |
| Security signal | Unusual authentication, policy override, exposure change or detection rule firing | Route to the security responder, not the service team | Mixing security and reliability routing produces alerts that two teams assume the other has handled |
| Noise, deliberately excluded | CPU utilisation alone, single failed request, non-critical job retry, informational events | Dashboard or log only | Every one of these has, at some point, been the alert that hid the real incident |
Every page is reviewed monthly. The review asks three questions: did it need a human, was it actionable within the response window, and did the runbook exist? Alerts that fail two of the three are rewritten or deleted, and the count of pages per shift is reported as a programme measure rather than treated as a badge of busyness.
On-Call, Escalation and Incident Command
On-call is a design problem with a human consequence. A rota that cannot be sustained will be abandoned, and an escalation path that has never been tested will fail at the moment it is used. We build both, then rehearse them.
| Role | Responsibility during an incident | Preparation required |
|---|---|---|
| On-call engineer | Acknowledges the page, assesses impact against the journey dashboard, executes the runbook, requests escalation when the runbook ends | Runbook per failure mode, access to the systems needed at two in the morning, and a shadow shift before solo duty |
| Incident commander | Owns the incident rather than the keyboard: sets severity, assigns work, holds the timeline, decides when it is over | A written command process, a severity definition, and at least one rehearsal per quarter |
| Communications lead | Updates the status page, informs the business and, where contractual, customers and regulators | Templates written before the incident, and an agreed list of who is told at each severity |
| Scribe | Records the timeline, decisions and evidence, which becomes the basis of the review | A single place to write, and a rule that the scribe does not also debug |
| Escalation target | Second-line specialists, the platform team, the vendor and, for a major incident, the technology head | Contact details verified quarterly, with a named alternative per role |
| Vendor and provider liaison | Opens the support case, provides the evidence the provider asks for, tracks their response | Support entitlements documented in advance, including severity definitions and response times you have actually purchased |
- Severity is defined by user impact, not by internal embarrassment, and the definition is written down before it is needed.
- Handover between shifts is a structured conversation with a written summary, because incidents that span a shift boundary lose their history otherwise.
- Compensation, time off in lieu and the maximum number of consecutive nights are agreed with the team, not announced to it.
- The rota is sized for sustainability: a team of four cannot cover a 24×7 rota without burnout, and pretending otherwise produces a rota on paper and an unanswered phone in practice.
- Escalation is tested by exercise, including the out-of-hours path and the vendor path, with the result recorded.
Capacity, Load Testing and Release Engineering
Reliability is mostly decided before an incident: by how much headroom exists, by whether a release can be undone, and by whether scaling actually works when it is triggered. These three are tested on purpose rather than discovered by accident.
| Activity | What we run | What it proves |
|---|---|---|
| Baseline load test | The critical journey at expected peak traffic, with realistic data volumes and concurrent users | Where the first constraint appears, and whether the latency objective survives peak |
| Soak test | Sustained load over hours, watching memory, connection pools, queue depth and disk | The slow leaks that a short test never shows, which are the ones that fail on a busy Monday |
| Spike test | A sudden multiple of normal traffic, as a campaign or a news event would produce | Whether autoscaling reacts in time and whether the queue absorbs the burst or sheds it |
| Failure injection | Dependency removal: a database replica, a third-party API, a region or an availability zone, a node | Whether the service degrades gracefully or fails completely, and whether the alert fires |
| Rollback rehearsal | A bad release deployed to a non-production environment and rolled back automatically and manually | That rollback works, how long it takes, and that the data migration does not prevent it |
| Scaling limits | Node pool and instance limits exercised to the maximum | Whether the configured maximum is enough, and what happens when it is reached |
| Recovery test | Restore from backup into a clean environment, timed against the recovery objective | That the recovery objective is achievable, which is the only evidence that counts |
| Progressive delivery trial | A release to a small percentage of traffic with automatic health comparison | That a regression is caught by the system before most users see it |
Load testing is scheduled before peaks rather than after them: before a festival sale, an examination result publication, a marketing campaign or a regulatory deadline. Where the estate includes marketing-driven traffic, we plan capacity with the campaign calendar from Digital Marketing Services rather than reacting to the first slow weekend.
Post-Incident Review and the Learning Loop
A review that does not produce a change with an owner and a date is a meeting. The structure below is what we run, and the tracking is what makes it work.
| Stage | When | Output |
|---|---|---|
| Immediate capture | During and straight after the incident | A timeline with timestamps, the evidence collected, the decisions taken and who took them |
| Blameless review | Within five working days, with everyone involved and no managers adjudicating fault | A narrative of how the system allowed the failure, the contributing factors, and what worked well — including the parts that did |
| Action items | At the review, each with an owner and a date | Prevention, detection and response actions separated, because improving detection is often cheaper than preventing |
| Tracking to closure | Weekly until closed, reported in the monthly reliability report | Aged action items visible to the technology head, which is what stops them becoming permanent |
| Near-miss capture | Continuously, with a low-friction route to report one | The incidents that did not happen, which are free lessons and the best indicator of a healthy reporting culture |
| Systemic review | Quarterly, across all incidents | Patterns that no single review would reveal: a dependency that keeps failing, a runbook that keeps being wrong, a team that keeps being paged for another team’s service |
| Objective revision | After a systemic review or a major incident | Objectives and budgets adjusted to reflect what the architecture can actually deliver, rather than defended for appearance |
We publish an anonymised internal record of reviews. Teams that can read what went wrong elsewhere prevent the same failure; teams that cannot will rediscover it, usually at an inconvenient hour.
The Twelve-Week Programme
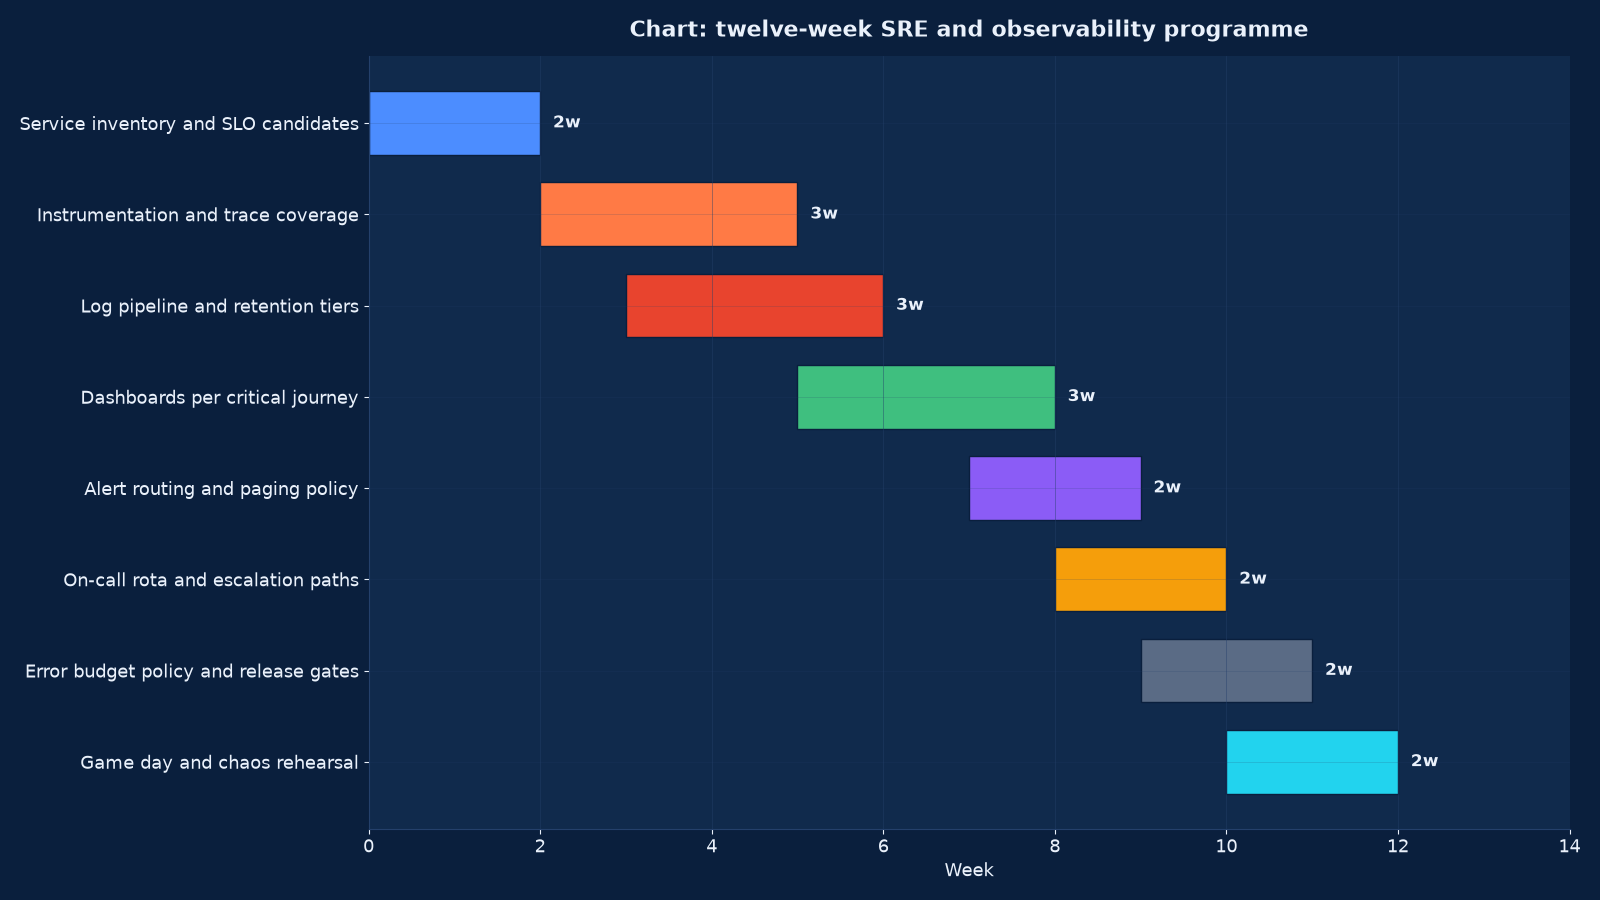
Chart values are an illustrative planning model based on typical UMC engagements and published industry benchmarks. They are not a guarantee of results on any specific project.
| Weeks | Workstream | Decision gate at the end |
|---|---|---|
| 1–2 | Service inventory and SLO candidates: ownership, criticality, journeys, dependencies, existing telemetry and incident history | The inventory is agreed by the technology head and every service has a named owner |
| 3–5 | Instrumentation and trace coverage: metrics, structured logs, trace context, health semantics, applied through the golden path | A reference service produces all three signals with one correlation identifier end to end |
| 4–6 | Log pipeline and retention tiers: collection, central store, retention by obligation and cost, access control | A query for a request identifier returns logs and traces from every service it touched |
| 6–8 | Dashboards per critical journey: journey, service, platform and executive views, each with an owner | Each journey dashboard answers ‘is it broken and how badly’ without an ad-hoc query |
| 8–9 | Alert routing and paging policy: burn-rate alerts, saturation forecasts, deployment regression, noise removal | An injected fault pages the owning team inside the SLO window and nothing else pages |
| 9–10 | On-call rota and escalation paths: roles, severity definitions, runbooks, compensation, handover format | A shift handover is performed and an escalation path is exercised end to end |
| 10–11 | Error budget policy and release gates: budgets agreed with the business, the consequence of exhaustion written down, gates wired into the pipeline | A release is blocked by an exhausted budget in a rehearsal, and the business accepts the policy |
| 11–12 | Game day and chaos rehearsal: failure injection, rollback, recovery from backup, incident command practised | The rehearsal produces a review with action items, and the recovery time is inside the objective |
Where an estate has no platform and no pipeline, the first four weeks are spent with DevOps & CI/CD Engineering establishing deployment and environment discipline, because observability without a controlled release process produces excellent dashboards of a system nobody can change safely.
What We Measure and Report
Twelve measures, monthly, with definitions published alongside them. They are chosen so that a technology head can see whether reliability is improving and a finance lead can see what it is costing.
| Measure | Definition | Direction of travel |
|---|---|---|
| SLO attainment per critical service | Successful requests or completed journeys over total, inside the window | At or above the objective, with any breach explained |
| Error budget remaining | Unused portion of the budget at month end | Positive for every critical service; a consistently exhausted budget means the objective or the architecture is wrong |
| Incidents by severity | Count per month, split by severity tier | Falling, with severity-one and severity-two incidents individually reviewed |
| Mean time to acknowledge | Page to human acknowledgement | Under five minutes, which is a rota and routing property rather than a heroism property |
| Mean time to restore | Incident start to service restored, from the incident record | Falling; in Figure 2, from nine hours to 1.8 |
| Alerts per incident | Alerts fired during an incident window | Falling towards the number that describe the incident rather than accompany it |
| Pages per on-call shift | Pages requiring human action, per shift | Falling, with a sustained low count being the sign of a sustainable rota |
| Actionable alert share | Pages that required a human action, over all pages | Rising towards 90 per cent or better |
| Change failure rate | Deployments requiring rollback or hotfix, over all deployments | Falling, and reported next to deployment frequency so the two are not traded silently |
| Deployment frequency | Production deployments per service per week | Rising as confidence rises; a falling frequency with a falling failure rate usually means the team has stopped releasing |
| Detection source | Share of incidents detected by monitoring versus reported by users or customers | Rising towards monitoring-detected, which is the measure of whether observability works |
| Telemetry cost per service | Observability spend allocated per service, against request volume | Stable or falling as retention and cardinality are tuned |
Detection source deserves emphasis. An estate where most incidents are reported by customers is an estate where telemetry describes the infrastructure rather than the service, and no amount of additional tooling fixes that until the objectives are set on journeys.
Tooling Decisions
Tools follow the questions. We are provider-neutral and will work inside what you have, because a migration of telemetry is usually the most expensive and least valuable option available. Where a change is warranted, these are the decisions and how we make them.
| Category | Options we commonly assess | How we choose |
|---|---|---|
| Metrics and alerting | Provider-native monitoring, Prometheus with a managed service, an all-in-one observability vendor | By the number of services, the retention you need and whether the team will operate the storage layer; native tooling first for small estates |
| Logging | Provider log services, a self-managed stack, a commercial log platform with tiered storage | By volume and obligation: retention requirements usually decide the design more than query features |
| Tracing | Provider tracing, an OpenTelemetry collector with a compatible back end, an application performance monitoring suite | By whether the services can be instrumented with a standard API; OpenTelemetry first, because it keeps the back end a replaceable decision |
| Incident management | A dedicated incident tool, the existing ticketing system with an incident workflow | By team size; a ticketing system with a good workflow beats a second tool nobody adopts |
| Status communication | Provider status pages, a third-party status service, manual communication for internal services | By whether customers or internal users need to see it, and by the contractual obligation to notify |
| Synthetic monitoring | Provider synthetics, an external monitoring service, a self-hosted checker | External wherever possible, because the value of a synthetic check is that it runs outside the system it measures |
| Load testing | Open-source load generators in the pipeline, a commercial distributed testing service | By peak traffic and whether the test must run from multiple geographies |
| Cost of telemetry | Sampling strategies, retention tiers, cardinality control, log filtering at source | Decided at design time; retrofitting cost control into an observability estate means losing data you may later need |
We record the reasoning for each choice in the same document as the inventory, so that the decision can be revisited when the estate changes rather than re-litigated when a vendor calls.
Observability Cost Discipline
Telemetry spend grows silently and can exceed the compute it observes. The controls below are applied at design time, because after a year of accumulation the only available lever is deleting data somebody might need.
| Lever | What it does | Typical effect |
|---|---|---|
| Retention tiers | High-resolution recent data, downsampled aggregates for history, cold archive where an obligation requires it | The largest single reduction, and the one that preserves the ability to answer old questions |
| Cardinality control | Bounding label values, refusing user identifiers and unbounded keys as labels | Prevents the exponential cost growth that surprises teams in month four |
| Adaptive and tail-based sampling | Sampling normal traffic while always capturing errors and slow requests | Retains the traces worth reading at a fraction of the volume |
| Log filtering at source | Dropping debug output and repetitive health-check logs before they are shipped | Commonly removes the majority of log volume with no loss of insight |
| Query discipline | Expensive queries identified, scheduled or replaced with a recorded metric | Reduces platform load and the cost of interactive exploration |
| Allocation per service | Telemetry cost attributed to the service that produces it, reported monthly | Changes behaviour more reliably than any central policy |
| Right-sized collection | Collecting what an objective or a runbook requires, and nothing to satisfy a fear | The honest version of the previous six levers |
This is the same discipline as platform cost governance, and where a cloud estate is large we run it with Cloud Cost Optimisation & FinOps Services so that observability spend is allocated, owned and reviewed like any other line.
Evidence From Our Work
The engagements below are published case studies and insight from this practice, each described by the subject its own page documents. They are the engagements where monitoring, infrastructure operation or availability under load was the work itself.
- Enterprise IT infrastructure management for Star TV — a 24×7 monitoring and support contract for a media and broadcasting company: alerting, escalation and continuous operation delivered as a service rather than a project.
- IT infrastructure support for Marriott Hotel and IT infrastructure for Fern Hotels & Resorts — multi-property hospitality estates with seasonal peaks, where support cover has to hold across sites and shifts.
- Switching, routing and server-room setup for Global Hospitals — a healthcare network’s switching and server-room infrastructure, where availability is a patient-safety question and the recovery objective is written down first.
- Mobile application development for a news company — a high-performance mobile estate whose traffic follows events, which is the hardest capacity and scaling profile to plan against.
- Ez1.in Services: a ground-up e-commerce platform rebuild — a services-plus-products catalogue where system architecture and technical stack decisions set the reliability envelope.
- Enterprise computer networks: architecture, trends, operations and career outlook — the network operations discipline that reliability work sits on top of.
- Website maintenance: the hidden cost businesses forget to budget for — what happens when nobody owns the running of a service, in cost terms.
- Website speed optimization guide — latency objectives and measurement from the user’s side of the interaction.
- The Technology insight archive — further writing on infrastructure, operations and engineering practice.
Engagement Models and Commercials
Four shapes cover the work. Most clients begin with the reliability assessment, because it produces the inventory and the objective proposal that every later decision depends on.
| Model | Best when | Duration and structure | What you receive |
|---|---|---|---|
| Reliability assessment | You cannot state how many services you run, who owns them, or what ‘working’ means | Two to four weeks, fixed fee | Service inventory with owners and criticality, telemetry audit, incident history analysis, proposed objectives per service, and a prioritised plan with effort estimates |
| SRE and observability build | The inventory exists and the practice needs building: instrumentation, dashboards, alerting, on-call, error budgets | Ten to fourteen weeks, staged with decision gates, joint team | Instrumented services, dashboard set, alert policy, on-call model with runbooks, error budget policy, a rehearsed game day and a signed handover |
| Incident and on-call uplift | Incidents are handled badly rather than infrequently: no command process, no communication templates, no reviews | Four to six weeks | Severity definitions, incident command process, communication templates, escalation paths tested, review structure and a backlog of preventive actions from the last year’s incidents |
| Reliability retainer | The practice exists and needs operating: on-call cover, capacity review, alert tuning, reporting | Monthly, three-month minimum, with measured service levels | On-call cover or support to your rota, monthly reliability report, quarterly capacity and alert review, and incident command when it happens |
Assessments are fixed fee. Builds are quoted after the assessment, because the scope depends on how many services need instrumentation and how much of the pipeline already exists. We will recommend the incident and on-call uplift alone where that is the actual problem, and it is the cheapest of the four.
Frequently Asked Questions About SRE & Observability
Do we need to hire site reliability engineers for this?
Eventually, in some form, but not first. The practice produces the job description: once you have an inventory, objectives and alert policy, you know what the role does and how many you need. Hiring first usually produces a capable engineer with nothing to operate and no mandate to change anything. Where you need capacity, IT Staff Augmentation Services supplies named engineers to your prioritisation.
What is a realistic availability objective?
The one your architecture can deliver and your business needs, which is often lower than instinct suggests. Each additional nine multiplies cost and complexity: 99.9 per cent permits about 43 minutes of downtime a month, 99.99 permits about four, and 99.999 permits about twenty-six seconds. Most internal and informational services should not be sold a fourth nine.
What is an error budget in practice?
The unreliability you have agreed to tolerate. At 99.9 per cent monthly, the budget is roughly 43 minutes. The team may spend it on releases and experiments; when it is gone, the agreed consequence applies — usually a freeze on non-critical change until reliability work restores it. The budget is what turns a reliability conversation from an argument into an accounting exercise.
How is this different from the monitoring we already have?
Monitoring answers the questions you anticipated. Observability lets you answer a new question about a system you have never seen behave this way, without deploying code. In practice the difference shows up in an incident: with monitoring you know something is wrong; with observability you can find out what, in minutes, using a correlation identifier that follows one request across every service.
Will this slow our developers down?
Instrumentation delivered through a golden path costs a team a day once. Alert noise costs everybody a night per incident, and a missing objective costs an argument every quarter. Where the concern is real, the answer is to put the instrumentation in the template rather than in each team’s backlog.
How much does observability cost to run?
Between a few per cent and, badly designed, more than the compute it observes. The determinants are retention, cardinality, log volume and sampling — all decided at design time. We build the cost controls in from the start and report telemetry cost per service monthly.
Can you provide on-call cover for us?
Yes, under a retainer with agreed service levels, or as second line behind your rota. We will not cover a service we have not documented: runbooks, escalation paths and access must exist first, which is why the build programme ends with a rehearsal.
How do you handle an estate with no pipelines and no infrastructure as code?
By sequencing: deployment discipline and environments first, then instrumentation, then objectives. Reliability practice on top of manual deployments produces excellent dashboards of a system nobody can change safely. DevOps & CI/CD Engineering is where that first stage sits.
What about our on-premises systems?
They are in the inventory and get objectives like everything else. Hybrid estates are common and the discipline is unchanged; only the instrumentation differs, and Managed IT Infrastructure & AMC covers the operating model for the on-premises side, including patching and support.
Do you set objectives for third-party services we depend on?
We record the objective the third party commits to, measure whether they meet it from our side, and design the fallback for when they do not. A dependency you cannot measure is a dependency you are trusting, and the trust should be a documented decision.
How do we know the programme worked?
Four things move: detection source shifts from customer-reported to monitoring-detected, mean time to restore falls, pages per shift fall while incidents stay visible, and error budgets stop being exhausted. In Figure 2 the same programme shows restoration time falling from nine hours to 1.8 and alerts per incident from 46 to nine.
Is this worth doing for a small estate?
Yes, at a smaller scale. Three services, one dashboard, two objectives, a rota with a tested escalation path and a review process is a full practice, and it costs a fraction of a platform programme. What is not worth doing is buying an observability suite for three services and leaving the objectives unwritten.
Commission a Reliability Assessment
Send us the list of services you believe you run, the last three incidents you remember, and the promise you have made to customers or to your board about availability. Within four weeks you will have a service inventory with named owners, a telemetry audit showing what you can and cannot answer today, an incident history analysis, proposed objectives and error budgets per critical service, and a costed plan covering instrumentation, alerting, on-call and the rehearsed handover — including the smaller option if that is what the estate needs.
Contact Unified Management Consulting to arrange a confidential first conversation.
Related Services
SRE and observability is delivered with the practices around it:
- Cloud Services & Migration (AWS, Azure, GCP) — the accounts and architecture the objectives are set against
- DevOps & CI/CD Engineering — pipelines, environments and progressive delivery, without which reliability cannot be released safely
- Managed IT Infrastructure & AMC — the operating model, patching and support layer beneath the practice
- Backup & Disaster Recovery — recovery objectives and the tested restore that makes them real
- Core Web Vitals & Performance Engineering — the user-side latency and experience measures that a backend objective cannot see
- Web Application Maintenance & Support — the retainer model for keeping an application estate current
- Routing, Switching, Firewall & Network Engineering — the network operations discipline a hybrid estate depends on
- Cloud Cost Optimisation & FinOps Services — telemetry and capacity spend allocated, owned and reviewed
- Enterprise Systems Integration — the contracts and failure behaviour of the systems reliability depends on
- Kubernetes & Container Platform Engineering — landing zone, cluster baseline, golden paths, CI/CD to a signed image registry, admission policy, observability, quotas and cost controls, all delivered as code with a rehearsed handover
- Cloud Security Posture Management (CSPM) — estate discovery, CIS baseline assessment, identity and exposure review, drift control as policy, compliance evidence and a severity-ranked remediation register with named owners
- Cloud-Native Application Modernisation — portfolio assessment and disposition, target architecture, strangler extraction, managed service and data migration, rehearsed cutover with a tested rollback, and hypercare
- Storage & SAN Engineering Services — SAN and NAS design, tiering, replication and the recovery evidence behind the capacity plan
- NOC & Network Monitoring Services — 24×7 monitoring, alert thresholds, incident response and the reporting that turns uptime into a number