
You’re driving traffic to your website—but how much of it converts? The average website conversion rate is just 2-3%, meaning 97% of your visitors leave without taking action. Our Conversion Rate Optimization (CRO) services systematically increase the percentage of visitors who become leads, customers, and revenue—without spending more on traffic.
CRO is the highest-ROI investment in digital marketing. A 1% improvement in conversion rate can double your revenue from the same traffic. We use data-driven experimentation, behavioral analysis, and UX optimization to unlock the hidden revenue already sitting in your website.
📋 CRO Services — Quick Summary
At a glance: everything we deliver through our conversion rate optimization services.
| Service | What We Do |
|---|---|
| Conversion Audit | Analytics deep dive, heatmap analysis, session recordings, user surveys, and heuristic evaluation |
| A/B Testing | Data-backed hypotheses, statistically rigorous tests on landing pages, checkout, forms, and navigation |
| Landing Page Optimization | Message match, persuasive design, form optimization, page speed, and mobile-first design |
| Funnel Optimization | Every stage from awareness to post-conversion, reducing drop-offs at each step |
| Personalization | Traffic source, geo, behavioral triggers, return visitor, and device-specific experiences |
| Industries Served | E-commerce, B2B/SaaS, Healthcare, Professional Services |
| Key Results | 30-100% conversion increase, 20-50% lower CPA, 223% average ROI |
| Investment | $3,000-$20,000/month or $5,000-$10,000 one-time audit |
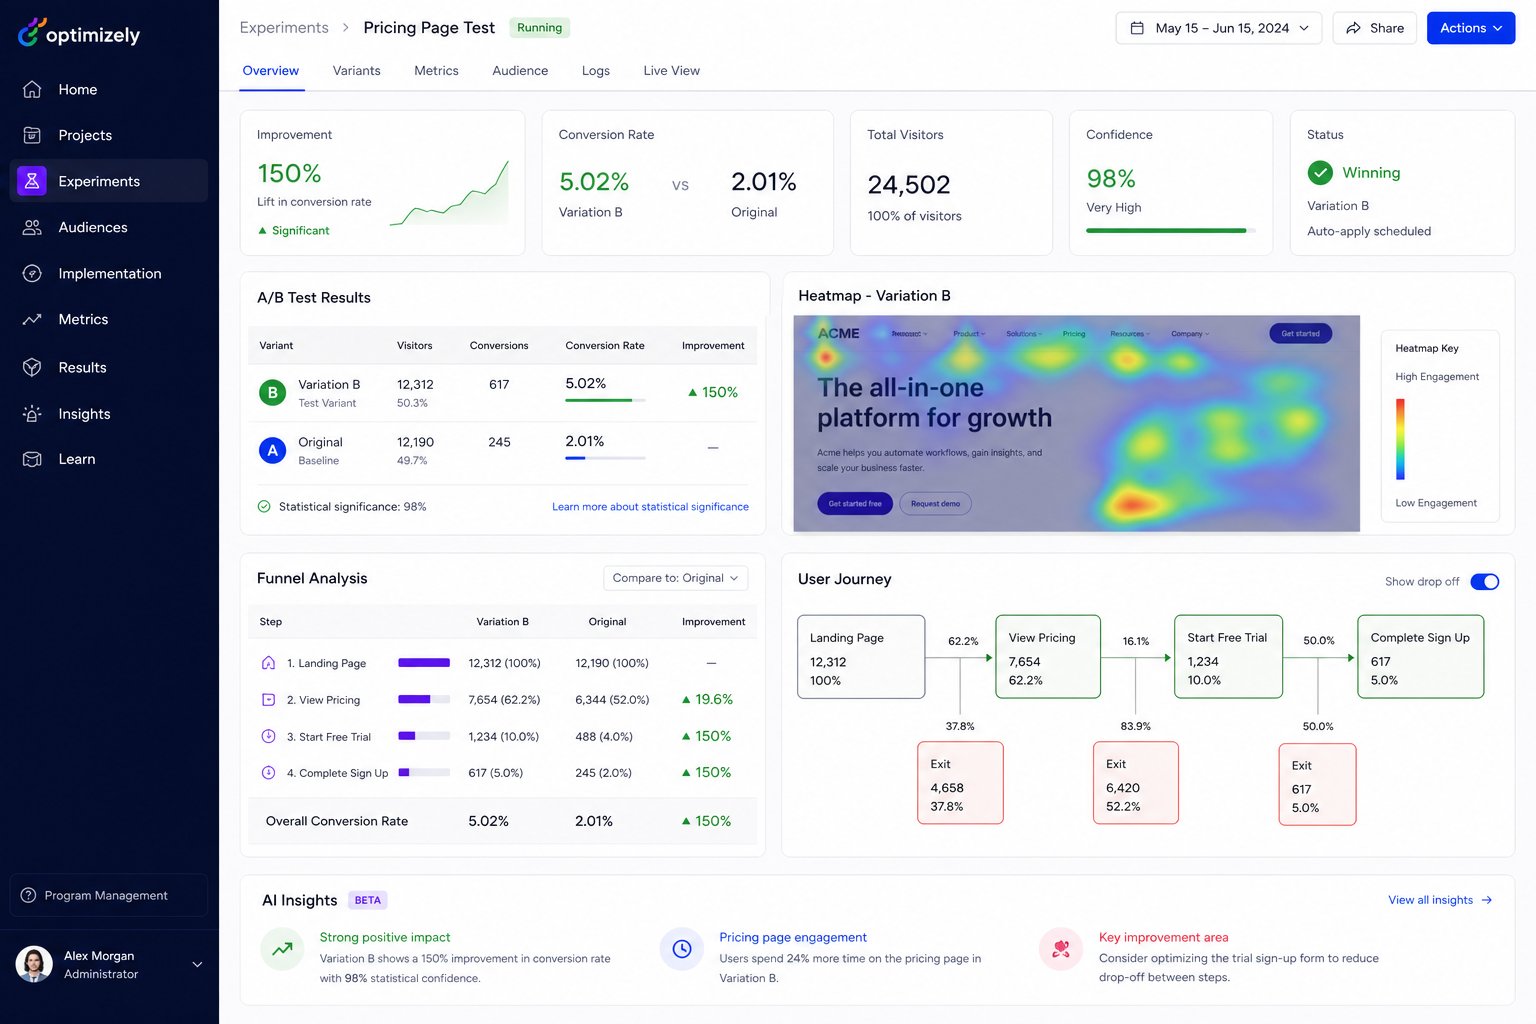
CRO Statistics: Why It’s the Highest-ROI Marketing Investment
| Metric | Data | Impact |
|---|---|---|
| Average website conversion rate | 2.35% | 97.65% of visitors leave without converting |
| Top 25% of sites convert at | 5.31%+ | 2.3x more revenue from same traffic |
| Top 10% of sites convert at | 11.45%+ | 5x more revenue from same traffic |
| Average CRO ROI | 223% | $2.23 return for every $1 invested |
| Companies using CRO | Only 22% | Massive competitive advantage |
| A/B tests that find winners | 1 in 7 tests | Systematic testing is essential |
| Cart abandonment rate | 69.99% | Huge opportunity for optimization |
| Page speed impact (1 second delay) | -7% conversions | Speed = revenue |
Why CRO Is the Highest-ROI Marketing Investment
- Multiply Existing Traffic Value: Double conversions without spending more on ads or SEO. Every visitor becomes more valuable.
- Lower Customer Acquisition Cost: Higher conversion rates mean lower cost per lead and customer across ALL channels simultaneously.
- Data-Driven Decisions: Replace guesswork with statistically validated experiments. Know what works instead of assuming.
- Compounding Results: Every winning test permanently improves your conversion rate. Improvements stack over time.
- Better User Experience: CRO improvements make your site better for all users, reducing friction and confusion.
- Competitive Advantage: Outperform competitors who waste traffic on poorly optimized sites. Only 22% of companies invest in CRO.
- Insights for All Channels: CRO learnings improve every marketing channel simultaneously—what converts on landing pages converts in ads, emails, and social.
- Permanent Improvements: Unlike paid ads that stop when you stop spending, CRO improvements are permanent and compound over time.
Our CRO Services
1. Conversion Audit & Research
We start with deep research to understand why visitors aren’t converting:
- Quantitative Analysis: Google Analytics deep dive into conversion funnels, drop-off points, user flows, and device-specific performance
- Heatmap Analysis: Visual heatmaps showing where users click, scroll, hover, and engage—or don’t
- Session Recordings: Watch hundreds of real user sessions to identify friction points, confusion, rage clicks, and dead clicks
- User Surveys: On-site surveys, exit polls, and post-purchase surveys to understand visitor intent, objections, and satisfaction
- Competitor Analysis: Conversion-focused competitive benchmarking of top 5 competitors’ user experiences
- Technical Audit: Page speed, mobile usability, cross-browser testing, and technical barriers to conversion
- Heuristic Analysis: Expert evaluation using proven frameworks (LIFT, MECLABS) to identify conversion barriers
2. A/B Testing & Experimentation
We run systematic experiments to find what converts best:
- Hypothesis Development: Data-backed hypotheses prioritized by PIE (Potential, Importance, Ease) and ICE (Impact, Confidence, Ease) frameworks
- Test Design: Statistically rigorous A/B and multivariate test designs with proper sample size calculations
- Landing Page Testing: Headlines, hero images, value propositions, CTAs, layouts, forms, social proof, and offers
- Checkout Optimization: Cart page, checkout flow, payment options, trust signals, and shipping information tests
- Form Optimization: Field count, labels, placeholders, validation, multi-step forms, and submission flow testing
- Navigation & UX Testing: Menu structure, search functionality, filters, and information architecture tests
- Pricing Page Testing: Pricing display, plan comparison, free trial CTAs, and guarantee placement
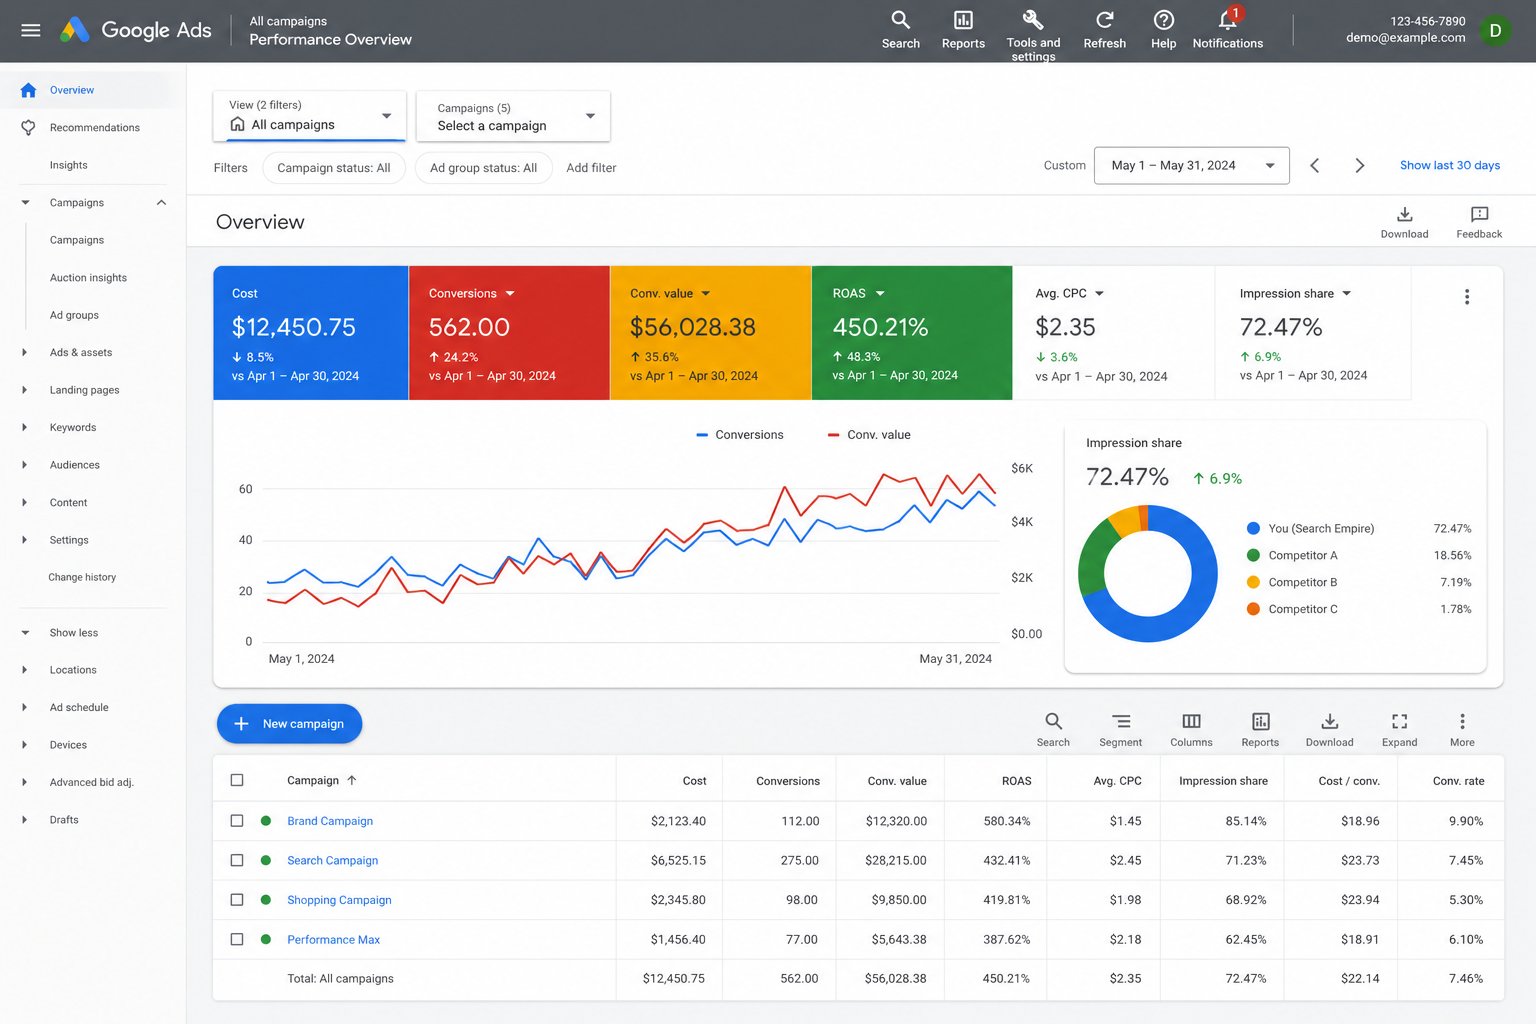
3. Landing Page Optimization
High-converting landing pages are the cornerstone of paid campaign success:
- Message Match: Perfect alignment between ad copy and landing page content—matching headlines, benefits, and CTAs
- Persuasive Design: Visual hierarchy, social proof (testimonials, logos, ratings), urgency, scarcity, and trust signals
- Form Optimization: Minimal fields, progressive profiling, inline validation, auto-fill, and friction reduction
- Page Speed: Sub-3-second load times for maximum conversions—every 1-second delay loses 7% of conversions
- Mobile Optimization: Mobile-first design for the 60%+ of traffic from mobile devices with thumb-friendly CTAs
- Personalization: Dynamic content based on traffic source, location, device, time of day, and behavior
- Video Integration: Product demos and explainer videos that increase conversions by 80%
4. Funnel Optimization
We optimize every step of your conversion funnel to reduce drop-offs:
- Awareness Stage: Ad-to-landing page alignment, first-impression optimization, and above-the-fold content
- Consideration Stage: Content engagement, comparison pages, social proof placement, and objection handling
- Decision Stage: Checkout flow, pricing page, CTA optimization, guarantees, and payment options
- Post-Conversion: Thank you pages, upsells, referral program integration, and onboarding
- Micro-Conversions: Newsletter signups, account creation, add-to-cart, and engagement metric improvements
5. Personalization & Behavioral Targeting
Deliver the right experience to the right visitor at the right time:
- Traffic Source Personalization: Different experiences for organic, paid, social, email, and referral visitors
- Geo-Targeting: Location-specific messaging, offers, shipping information, and currency display
- Behavioral Triggers: Exit-intent popups, scroll-triggered offers, time-based messaging, and inactivity detection
- Return Visitor Recognition: Different experiences for new vs. returning visitors based on previous behavior
- Device Optimization: Tailored experiences for desktop, tablet, and mobile users with device-specific CTAs
CRO Impact by Page Type
| Page Type | Avg. Conversion Rate | After CRO | Revenue Impact |
|---|---|---|---|
| Landing Pages | 2-5% | 5-12% | ⭐⭐⭐⭐⭐ |
| Product Pages | 1-3% | 3-8% | ⭐⭐⭐⭐⭐ |
| Checkout/Cart | 30-40% (of cart) | 45-60% | ⭐⭐⭐⭐⭐ |
| Pricing Pages | 2-4% | 5-10% | ⭐⭐⭐⭐ |
| Homepage | 1-3% | 3-6% | ⭐⭐⭐⭐ |
| Lead Forms | 3-8% | 8-20% | ⭐⭐⭐⭐⭐ |
CRO by Industry
E-commerce
- Product page optimization with social proof, urgency, and clear CTAs
- Cart abandonment reduction through simplified checkout and trust signals
- Category page optimization for better product discovery and filtering
- Search and filter optimization for improved product findability
- Upsell and cross-sell optimization on product and cart pages
B2B & SaaS
- Demo request and free trial signup optimization
- Pricing page clarity and plan comparison optimization
- Lead form optimization with progressive profiling
- Onboarding flow optimization for activation and retention
- Feature page optimization for upgrade conversions
Healthcare & Professional Services
- Appointment booking flow optimization and calendar integration
- Contact form and consultation request optimization
- Trust signal and credential placement testing
- Patient portal signup and engagement optimization
Our CRO Process
Phase 1: Research & Discovery (Weeks 1-3)
- Analytics audit and conversion funnel analysis (all devices, all traffic sources)
- Heatmap installation (Hotjar/Clarity) and 2-week data collection period
- User research: on-site surveys, session recordings (100+ sessions reviewed), usability testing
- Competitive conversion benchmarking of top 5 competitors
- Heuristic analysis using LIFT and MECLABS frameworks
- Hypothesis generation and prioritization (PIE/ICE framework, 20+ hypotheses)
- Technical audit: page speed, mobile usability, cross-browser compatibility
Phase 2: Testing & Optimization (Ongoing Monthly)
- 2-4 A/B tests running simultaneously across highest-impact pages
- Statistical significance tracking (95%+ confidence required for winners)
- Winner implementation and loser analysis with documented learnings
- New hypothesis generation from test learnings and user behavior data
- Monthly reporting: tests run, wins, lifts, revenue impact, and next priorities
Phase 3: Scale & Expand (Quarterly)
- Expand testing to additional pages and user flows
- Implement personalization and behavioral targeting programs
- Develop conversion-optimized design system for new pages
- Build internal CRO capability and knowledge transfer
CRO Technology Stack
| Tool | Purpose | Key Capabilities |
|---|---|---|
| Google Optimize / VWO | A/B testing platform | Visual editor, statistical engine, targeting |
| Hotjar / Microsoft Clarity | Behavioral analytics | Heatmaps, recordings, surveys, funnels |
| Google Analytics 4 | Conversion analytics | Funnel analysis, attribution, segments |
| Optimizely | Enterprise experimentation | Multi-variate, feature flags, personalization |
| Crazy Egg | Visual analytics | Scroll maps, confetti, overlay reports |
| Unbounce / Instapage | Landing page builders | Rapid prototyping, A/B testing, templates |
CRO Results & ROI
Our CRO clients typically achieve:
- 30-100% increase in conversion rates through systematic testing
- 20-50% reduction in cost per acquisition across all channels
- 223% average ROI on CRO investment within the first year
- 15-30% improvement in average order value through upsell optimization
- 40-60% reduction in cart abandonment rates
- 25-40% more leads from the same website traffic
- 10-25% increase in email signup rates from form optimization
- 3-5 winning tests per quarter that permanently improve conversion rates
CRO Pricing
| Package | Includes | Investment |
|---|---|---|
| Audit & Strategy | Full conversion audit, user research, hypothesis roadmap (one-time) | $5,000-$10,000 |
| Growth | 2 A/B tests/month, heatmap analysis, monthly reporting | $3,000-$6,000/month |
| Scale | 4+ tests/month, personalization, user research, landing pages | $6,000-$12,000/month |
| Enterprise | Full experimentation program, dedicated CRO team, multi-site | $12,000-$20,000/month |
Related Web Engineering Services
These offerings are delivered alongside this service. Website strategy, accessibility, performance, maintenance and platform engineering are usually combined rather than bought separately, and most engagements start with a paid diagnostic.
- Core Web Vitals & Performance Engineering — field instrumentation, LCP, INP and CLS engineering, third-party governance, performance budgets and a pipeline regression gate
- Accessibility (WCAG) Remediation & Compliance — WCAG 2.2 Level AA audits, severity-ranked defect registers, design-system remediation, assistive-technology verification and accessibility statements
Related Digital Marketing Services
These offerings are delivered alongside this service. Channel work is usually combined rather than bought separately: paid media with measurement, organic with content, and campaigns with the lifecycle that follows them. Most engagements start with a paid assessment or audit.
- Lead Nurturing & Drip Programme Services — Lead nurturing and drip programmes: stage definitions, lead scoring, sequences by buying stage, CRM handover, recycling rules and holdout testing
- Lifecycle & Retention Campaign Services — Lifecycle and retention campaigns: deliverability, RFM segmentation, welcome, replenishment and win-back flows, offer guardrails and holdouts
- Webinar & Event Campaign Services — Webinar and event campaigns: topic and offer design, registration, promotion, attendance programmes, delivery, segmented follow-up and repurposing
- Performance Max (PMax) Management Services — Performance Max management: conversion values, asset groups, feed and audience signals, exclusions, incrementality tests and weekly governance
Frequently Asked Questions
How long does CRO take to show results?
Quick wins often appear within 2-4 weeks of the first tests. Significant, compounding improvements typically take 3-6 months of systematic testing. We aim for 3-5 winning tests per quarter.
How much traffic do I need for CRO?
Ideally 5,000+ monthly visitors for meaningful A/B tests with statistical significance. For lower traffic sites, we use heuristic analysis, user research, qualitative insights, and multivariate approaches.
How much does CRO cost?
Our CRO services range from $3,000-$20,000/month depending on site complexity, test volume, and optimization scope. One-time audits start at $5,000.
What’s a good conversion rate?
It varies by industry and page type: E-commerce averages 2-3%, B2B lead gen 3-5%, SaaS free trials 5-7%, landing pages 2-5%. Top performers in every category achieve 2-5x their industry average.
Do you redesign our entire website?
No. CRO is about incremental improvements through testing, not complete redesigns. We test specific elements and implement only what statistically improves conversions.
Can CRO work alongside our other marketing?
Absolutely. CRO amplifies every marketing channel by converting more of the traffic you’re already driving. It’s the force multiplier for SEO, PPC, social media, and email marketing.
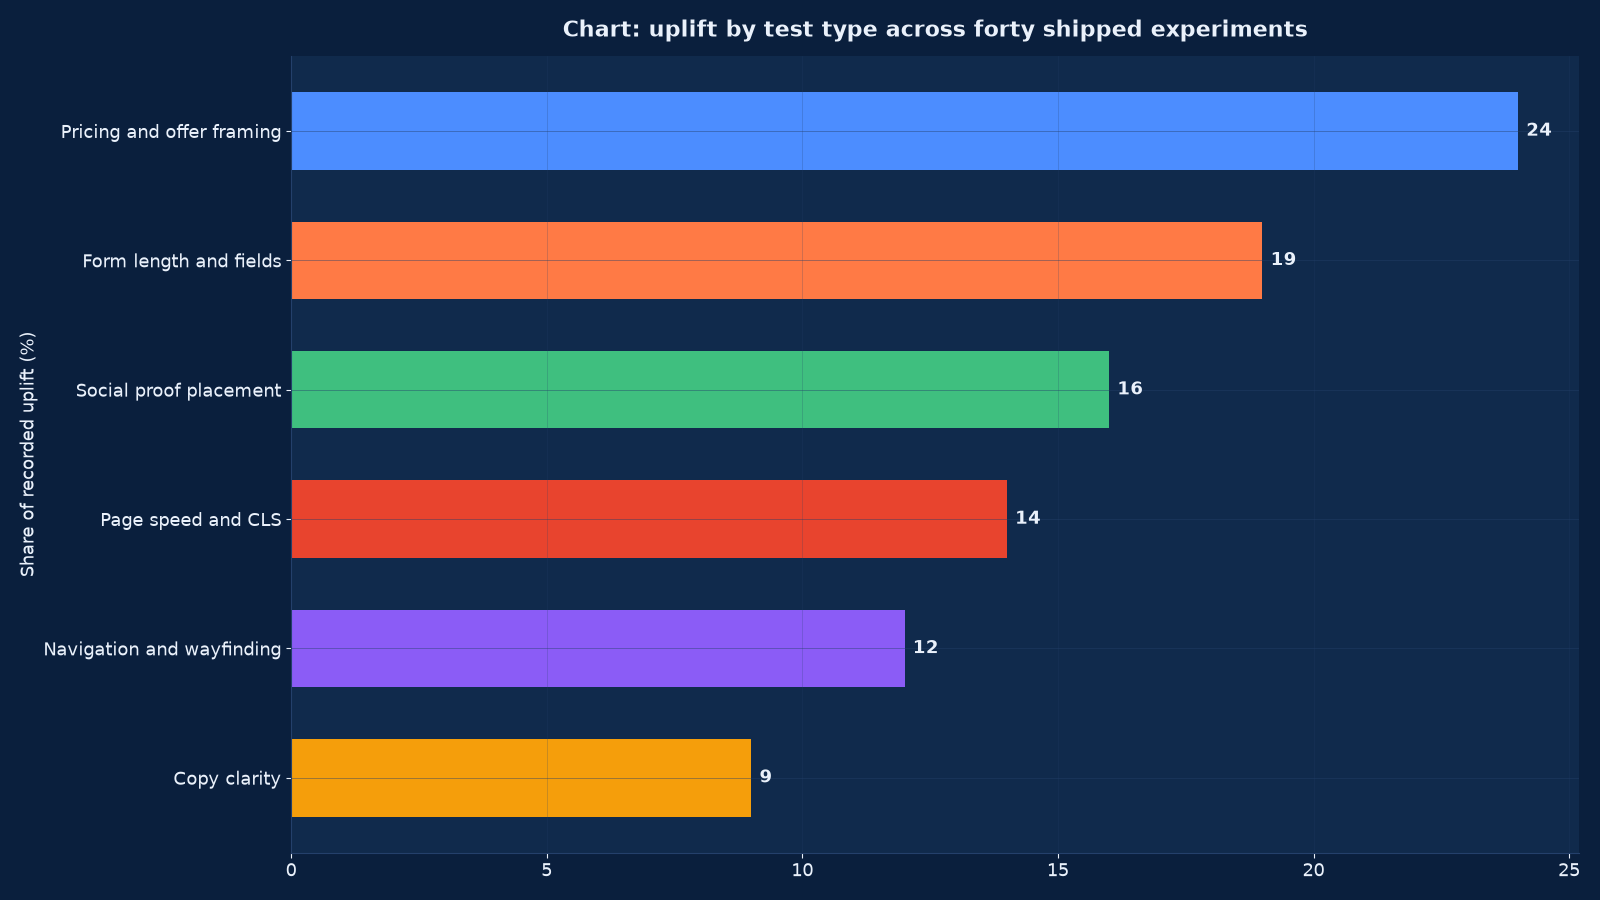
Chart values are an illustrative planning model based on typical UMC engagements and published industry benchmarks. They are not a guarantee of results on any specific project.
Conversion rate optimisation is not a set of tricks applied to a button. It is an instrumented argument: research produces a hypothesis, a test produces evidence, and the evidence either changes the page or changes what the business believed about its customers. Without the instrumentation there is no evidence, and without the evidence there is only opinion with a deadline.
Conversion rate optimisation at Unified Management Consulting covers the whole discipline: analytics, goal and funnel instrumentation, qualitative research from heatmaps, session recordings, surveys and support logs, a scored hypothesis backlog, test design and quality assurance, traffic allocation and significance review, and a wins log with a roadmap handed over at the end. We run this for e-commerce and retail, service businesses with enquiry forms, SaaS and app sign-ups, clinics and practices taking bookings, education providers, hospitality taking direct reservations, and B2B sites whose conversion is a qualified enquiry rather than a transaction.
The engagement is deliberately research-led. A test written from a best-practice list usually produces a small, unrepeatable result, while a test written from a session recording that shows forty people failing the same field produces a large one. Figure 2 shows what happens when the discipline is installed rather than improvised: the share of research-informed tests rises from 6 to 69 per cent, and the share of tests reaching significance rises from 21 to 72 per cent alongside it.
What This Service Actually Covers
The service covers instrumentation, research, testing and handover. It is delivered as a twelve-week engagement with two test waves, then as a standing programme or a documented handover to an internal team.
| Component | What we do | What you keep | Duration |
|---|---|---|---|
| Instrumentation | Events, goals, funnels, e-commerce or lead data and destination verification | A measurement layer the whole business can trust | 1–2 weeks |
| Quantitative baseline | Conversion by device, source, journey and segment, with the leakage points identified | A baseline document that states where the losses are | 1 week |
| Qualitative research | Heatmaps, session recordings, on-site surveys, support logs and stakeholder interviews | A research file with the evidence behind every hypothesis | 2–3 weeks |
| Hypothesis backlog | Hypotheses written to a template and scored for impact, confidence and ease | A ranked backlog with the reasoning attached | 1 week |
| Test build and QA | Variants built, tested across devices and browsers, and validated against the events | A QA checklist that prevents a test measuring a broken variant | 1–2 weeks per wave |
| Traffic allocation | Allocation and duration set from volume and the smallest effect worth detecting | A running rule rather than a guess per test | Ongoing |
| Significance review | Results read against the pre-declared hypothesis and metric, with segment breakdowns | A decision per test: ship, iterate or stop, with the reason | Per test |
| Wins log and roadmap | Every result recorded with its effect size and the next quarter’s plan | A document that makes the programme resumable by anyone | Ongoing |
| Handover | Documented process, templates, tooling access and training | A discipline the internal team can continue | 2 weeks |
The instrumentation comes first and is not optional. A test run on top of incomplete event data produces a confident answer to the wrong question, and the cost is not the test — it is the decision that follows it.
Why This Is a Measurement Discipline Before It Is a Design One
| Question | What a design-led programme does | What a measurement-led programme does |
|---|---|---|
| What is broken? | Applies best practices and hopes | Instruments the funnel, finds where the loss is, and researches why |
| What should we test? | Whatever the agency has seen work elsewhere | Whatever the evidence in this account’s data and recordings supports |
| How will we know? | Looks at the conversion rate after the change | Pre-declares the metric, the segment, the minimum detectable effect and the duration |
| What if traffic is low? | Runs the test anyway and reads noise as signal | Uses a larger effect target, a longer window, or a qualitative method instead |
| What if the test loses? | Reports it briefly and moves on | Records it in the wins log, because a loss is information about the customer |
| What happens at the end? | The agency leaves with the learning | A wins log, a roadmap and a trained internal owner |
| What is the return? | Sum of the reported lifts | The compounded effect of shipped wins, minus the tests that cost traffic and taught nothing |
Where Uplift Actually Comes From
Figure 1 is the distribution of recorded uplift across a two-quarter programme, and it is typical in shape: the commercial levers outperform the cosmetic ones by a wide margin.
| Lever | Share of recorded uplift | What the test usually changes | Why it works |
|---|---|---|---|
| Pricing and offer framing | 24 per cent | How the price is presented, what is bundled, what the guarantee is, how payment is staged | It changes the decision, not the presentation of the decision |
| Form length and fields | 19 per cent | Which fields are required, their order, their labels, and what is asked after submission instead | Every unnecessary field is a place to abandon |
| Social proof placement | 16 per cent | Where reviews, counts, logos and testimonials appear relative to the decision point | Proof read before the ask does work; proof read after it does not |
| Page speed and layout shift | 14 per cent | Load time, cumulative layout shift and the stability of the button under a thumb | A shifting or slow page loses the tap, and the loss looks like indifference |
| Navigation and wayfinding | 12 per cent | Whether the next step is obvious, and whether the path back is available | Confusion does not announce itself; it leaves |
| Copy clarity | 9 per cent | Headings, the first paragraph, the call-to-action wording and the removal of ambiguity | Clarity converts; cleverness usually does not |
This ordering is why our roadmap begins with the offer and the form. Businesses routinely reverse it, testing headline wording for a quarter while an unnecessary phone-number field removes a fifth of their mobile enquiries.
Instrumentation: Analytics, Events and Funnels
| Layer | What must be true | The failure without it |
|---|---|---|
| Event model | A documented event per meaningful interaction, with consistent naming and parameters | Every report answers a slightly different question |
| Goal and conversion definition | One definition of a conversion, agreed with sales or finance | Marketing reporting a conversion the business does not count |
| Funnel steps | Each step of the journey instrumented, including the steps that are not pages | Leakage visible only at the end, never in the middle |
| E-commerce or lead data | Value, currency, items, and lead type captured | Conversion rate optimised without any view of value |
| Destination verification | The tracking tested on the live page, not only in a debug tool | A test whose control and variant both under-report |
| Cross-device and cross-session | Where the journey spans devices, the measurement says so | A mobile-heavy journey judged as a failure to convert |
| Segment dimensions | Device, source, campaign, geography, customer type and journey entry | An average that hides a segment converting at half the rate |
| Data retention and consent | Consent state respected and retention configured | A measurement layer that is both unreliable and exposed |
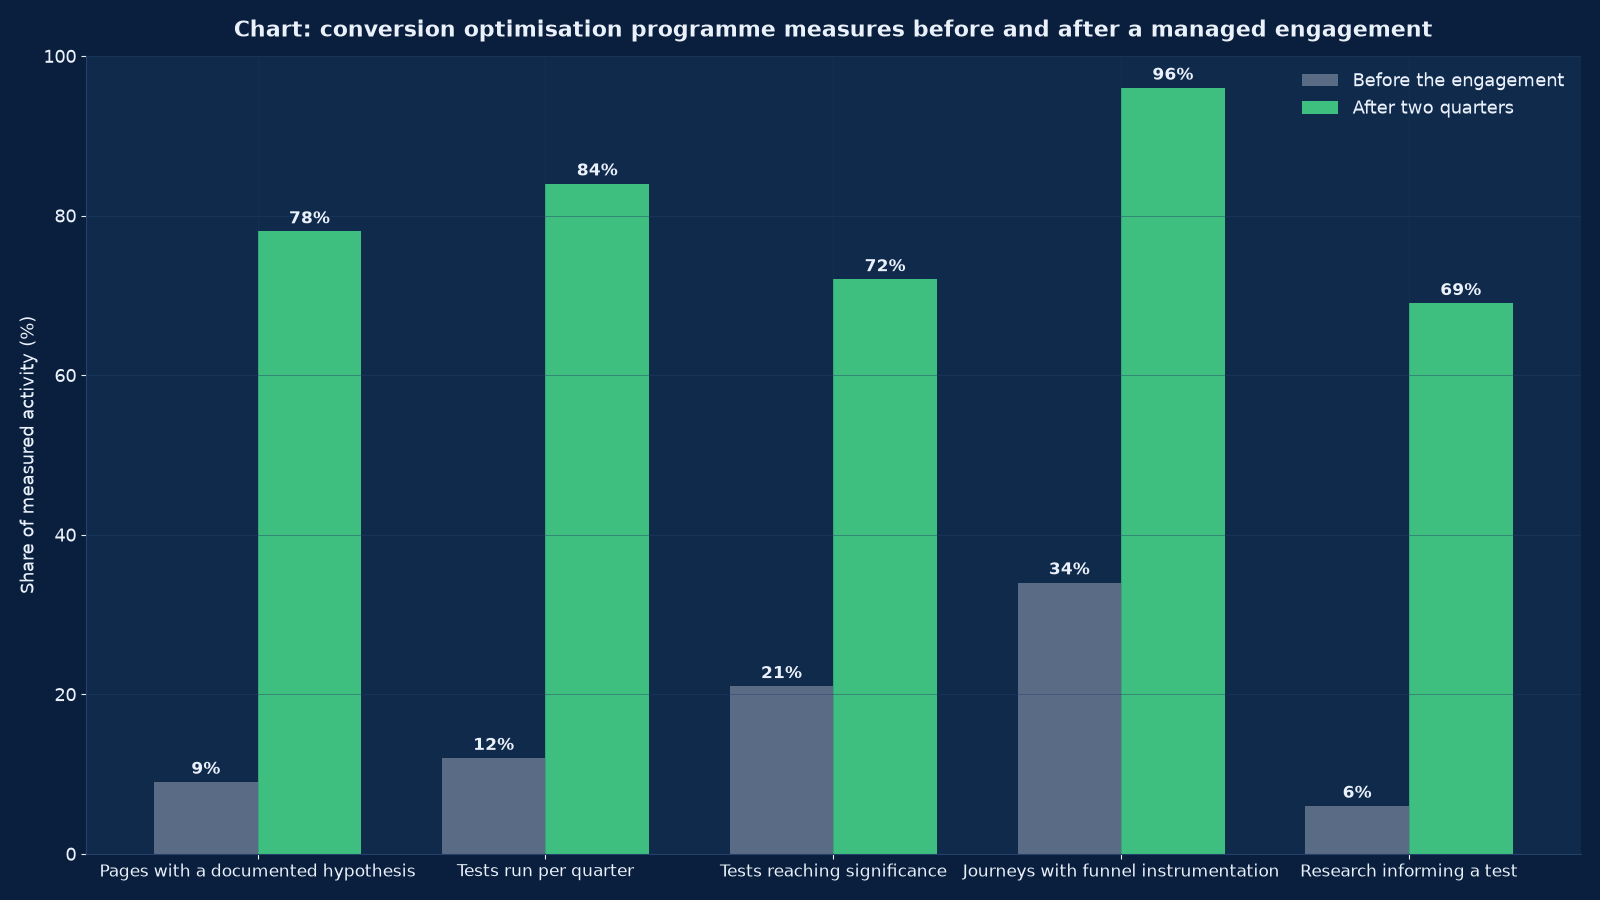
Chart values are an illustrative planning model based on typical UMC engagements and published industry benchmarks. They are not a guarantee of results on any specific project.
Research: Finding the Reason Behind the Number
| Method | What it reveals | How we run it |
|---|---|---|
| Funnel analysis | Where the loss is, by step, device and segment | Read per segment; an average funnel hides the worst experience |
| Heatmaps and scroll depth | What is seen, what is clicked and what is ignored | Compared across devices, because the mobile heatmap is a different page |
| Session recordings | The actual failure: a field that rejects a valid entry, a button that moves, a menu that traps | Sampled by segment and by outcome, watched with the hypothesis in mind |
| On-site surveys | Why a visitor is here and what stopped them | One question, asked at exit or after conversion, never as a modal on arrival |
| Support and sales logs | The objections customers state in their own words | Coded by theme; the top three objections become the first three tests |
| Stakeholder interviews | What the business believes, and where belief and data disagree | Recorded, because the disagreement is usually the highest-value test |
| Competitor and category review | What the category’s buyers have been trained to expect | Used to identify a missing expectation, not to copy a layout |
| Technical and speed audit | Load time, layout shift, errors and broken flows | Tested on real devices and real connections, not on an office network |
| Usability sessions | Tasks attempted aloud, with the friction named | Five to eight sessions per journey; the pattern appears by the fifth |
Every hypothesis in the backlog cites the research that produced it. A hypothesis with no citation is an opinion, and in Figure 2 the share of tests informed by research rises from 6 to 69 per cent, which is the single change most associated with tests reaching significance.
Hypothesis Backlog and Scoring
| Field | What it must contain | Why |
|---|---|---|
| Observation | The data or research finding, with the segment it applies to | So the hypothesis can be checked against the evidence later |
| Problem | What the customer is failing to do, in their terms | So the test addresses a barrier rather than a preference |
| Hypothesis | If we change X for segment Y, then metric Z will move because of the stated mechanism | So the result is interpretable either way |
| Primary metric | One metric, pre-declared | So the test cannot be re-read until something significant appears |
| Guardrail metrics | The measures that must not fall: average order value, lead quality, bounce | So a win on one metric is not a loss on the business |
| Impact, confidence, ease | A score per dimension, with the reasoning | So the backlog can be ranked rather than argued about |
| Minimum detectable effect | The smallest change worth shipping, given the traffic | So duration and allocation are decided before launch, not after |
| Owner and date | Who builds it, who QA’s it, when it runs | So the backlog does not become a wish list |
Scoring is honest about confidence: a hypothesis derived from forty session recordings scores higher than one derived from a best-practice article, and the difference is visible in the backlog rather than negotiated in a meeting.
Test Design: What Makes a Test Valid
| Decision | Standard | The invalidity it prevents |
|---|---|---|
| One variable per test | A single change, or a bundle explicitly declared as a redesign test | A result nobody can attribute to a cause |
| Pre-declared metric and hypothesis | Written before launch and not revised afterwards | Reading the data until something looks significant |
| Sample size and duration | Calculated from baseline rate, minimum detectable effect and traffic, then respected | Stopping early because the result looks good |
| Allocation | Consistent per user, so nobody experiences both variants | A user seeing two prices and a metric nobody can trust |
| Segment coverage | Every device, browser and major source represented in both arms | A variant that wins on desktop and loses on mobile, averaged into a win |
| Event parity | The same events firing in control and variant, verified before launch | A variant that appears to convert more because it tracks differently |
| Novelty and seasonality | Run long enough to pass the novelty effect, and not across a campaign or a holiday unless that is the subject | A lift that disappears in week three |
| Guardrails | Average order value, lead quality and support volume watched during the test | A conversion win that reduces revenue |
Low Traffic: the Problem Most Businesses Actually Have
| Constraint | What it means | The honest response |
|---|---|---|
| Fewer than a few hundred conversions a month | A test detecting a ten per cent relative change may need longer than a quarter | Target larger effects, test fewer things, and use qualitative research for the rest |
| Seasonal traffic | Volume varies enough to make duration unpredictable | Schedule tests into the stable periods and use the peaks for launches |
| Long consideration cycles | The conversion happens weeks after the session | Measure an intermediate event with a stated relationship to the real one |
| Low-value, high-volume transactions | Statistical power is available but the effect per test is small | Bundle related changes into a redesign test and accept the attribution cost |
| B2B with a handful of deals a month | Conversion testing is not the right instrument at all | Test the enquiry form and the qualification path, and use research plus sales feedback for everything else |
| Multiple sites or locales | Each has its own volume | Test the largest, then validate the winner on the others rather than testing each |
We state plainly when a site does not have the traffic for a testing programme and propose the research-led alternative. Running underpowered tests and reporting the noise as wins is the most common way this discipline loses credibility inside a business.
Page-Level Levers and What the Evidence Says
| Element | What we test | What usually wins |
|---|---|---|
| The offer | Bundling, guarantees, payment staging, trial length, what is included | A clearer statement of what the customer gets for the money, and lower perceived risk |
| Price presentation | Anchoring, unit framing, instalment display, comparison | The framing that matches how the customer already thinks about the category |
| The form | Field count, order, labels, inline validation, optional versus required | Fewer required fields, honest labels, and progressive profiling after submission |
| The call to action | Wording, position, contrast, one versus several | A single action described in the customer’s terms, above the fold and repeated at the decision point |
| Social proof | Placement, type, quantity, specificity | Specific proof near the decision: a number, a named outcome, a recognisable client |
| Headings and first paragraph | Clarity, specificity, the removal of abstraction | A statement of who it is for and what it does, before any cleverness |
| Imagery | Real product and people versus stock, and the information an image carries | Real imagery that answers a question the copy cannot |
| Trust and risk | Returns, security, contact details, credentials, policies | Risk removal placed where the risk is felt, not in the footer |
| Speed and stability | Load time, layout shift, interaction delay | A stable button and a page that is usable before it is fully loaded |
| Mobile layout | Thumb reach, input types, sticky elements, image weight | A layout designed for the device rather than shrunk to it |
Journey-Level Levers
| Journey problem | Symptom | The test |
|---|---|---|
| The wrong entry page | High bounce from paid traffic on a generic page | A dedicated landing page matching the ad’s promise, tested against the generic destination |
| A broken path between steps | Drop-off concentrated at one transition | The transition rebuilt: fewer steps, clearer progress, saved state |
| No route back | Users restarting rather than continuing | A visible path back, and a persistent cart or enquiry state |
| Search that fails | Site search returning nothing for common terms | Synonyms, spelling tolerance and a useful empty state |
| Checkout friction | Abandonment at payment or delivery | Guest checkout, address lookup, payment options and a cost shown early |
| Enquiry dead end | A form submitted with no confirmation or next step | A confirmation that states what happens next and when |
| Mobile abandonment | Mobile converting at half the desktop rate | A mobile-specific journey rather than a responsive desktop one |
| Post-conversion loss | A purchase that generates no second action | A post-purchase path: an account, a review request, a related offer |
Speed, Core Web Vitals and Conversion
Page speed and layout stability appear in Figure 1 as 14 per cent of recorded uplift, which is large for something most programmes treat as an engineering matter. The mechanism is simple: a button that moves under a thumb, or a page that is not usable for three seconds, produces an abandonment that analytics records as indifference.
| Measure | What it affects | The conversion consequence |
|---|---|---|
| Load and interaction delay | Whether the page is usable when the visitor arrives | Bounce before the value proposition is read |
| Cumulative layout shift | Whether elements move after render | Mis-taps, abandoned forms and a loss of trust that looks like a preference change |
| Image and script weight | Performance on mobile networks | A materially worse experience for exactly the audience that converts least |
| Render order | Whether the call to action and proof arrive early | A page that is technically fast and experientially slow |
| Third-party scripts | Tag managers, chat widgets, pixels and A/B tools | Each one adding delay and each one capable of breaking a test |
| Caching and delivery | Repeat visits and returning customers | A worse experience for the audience most likely to convert |
We treat performance work and conversion work as one programme. A test that improves copy on a page that shifts under the user’s thumb is measuring the wrong thing, and a performance fix with no measurement cannot be shown to have paid.
The Twelve-Week Engagement
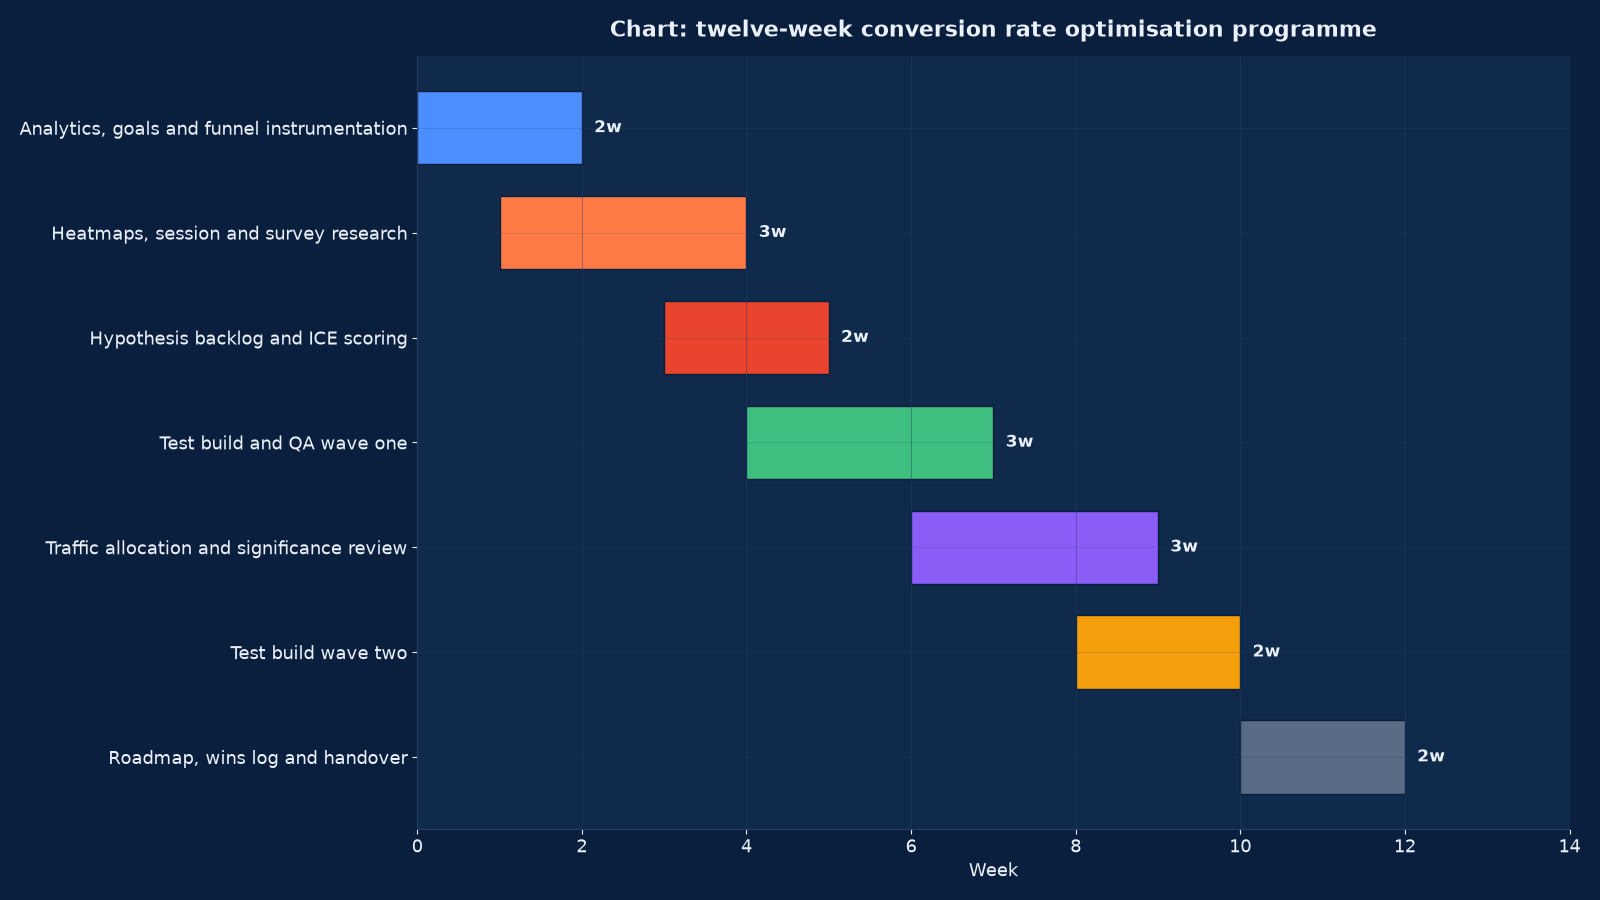
Chart values are an illustrative planning model based on typical UMC engagements and published industry benchmarks. They are not a guarantee of results on any specific project.
| Weeks | Workstream | Gate to pass |
|---|---|---|
| 1–2 | Analytics, goals and funnel instrumentation | One agreed conversion definition, every funnel step instrumented and verified live |
| 2–4 | Heatmaps, session and survey research | A research file with the top barriers named and evidenced |
| 4–5 | Hypothesis backlog and scoring | A ranked backlog, every hypothesis citing its research |
| 5–7 | Test build and QA, wave one | Variants QA’d across devices, with event parity confirmed before launch |
| 7–9 | Traffic allocation and significance review | Duration respected, results read against the pre-declared metric and guardrails |
| 9–10 | Test build, wave two | The next wave built from what the first taught, not from the original list |
| 11–12 | Roadmap, wins log and handover | A wins log with effect sizes, a next-quarter roadmap and a trained internal owner |
Two waves in twelve weeks is a realistic pace for most sites: one wave to install the discipline and prove it, one to compound it. Programmes that promise weekly tests on a low-traffic site are promising noise.
Conversion Optimisation for Different Business Models
| Model | The conversion event | What the research focuses on | The usual first test |
|---|---|---|---|
| E-commerce | Purchase, with value and margin | Checkout friction, delivery and returns clarity, product page doubt | The offer and the checkout steps |
| Lead generation | A qualified enquiry | Form friction, credibility, and whether the promise matches the ad | Form length and the enquiry promise |
| SaaS and app | Sign-up and activation | Onboarding comprehension and the moment of first value | The sign-up path and the activation step |
| Booking and reservation | A completed booking | Availability clarity, cancellation policy and payment friction | The date and price presentation |
| Clinics and practices | A consultation request | Trust, cost anxiety and the reality of the visit | Proof placement and the process explanation |
| Education | An application or enquiry | Outcome clarity, entry requirements and the funding question | The outcome statement and the next-step path |
| B2B services | A qualified meeting request | Credibility, sector relevance and what happens after the form | The evidence on the page and the form’s field set |
| Marketplace | A completed transaction between two sides | Trust between parties and the search-to-listing path | Search relevance and listing clarity |
Personalisation and Segmentation
| Approach | When it is worth it | The risk |
|---|---|---|
| Device-specific layouts | Almost always, where mobile converts materially differently | Two experiences to maintain and two sets of tests to run |
| Source-matched landing pages | Where paid traffic arrives with a specific promise | Page proliferation without governance, and duplicate content if not handled |
| New versus returning | Where the two populations have different objections | A returning-customer experience that hides information a first-timer needs |
| Geography and language | Where offer, price or availability genuinely differs | A translation that is not a localisation |
| Behavioural triggers | Exit intent, scroll depth, cart value | Interruption that costs more conversion than it recovers |
| Customer-type journeys | Trade versus retail, or business versus consumer | A selector that customers get wrong, sending them down the wrong path |
Personalisation is tested like anything else, and it is usually the second or third wave rather than the first. Segmentation before instrumentation produces a set of experiences nobody can measure.
Governance, the Wins Log and Handover
| Artefact | Contents | Why it survives the engagement |
|---|---|---|
| Instrumentation document | Events, goals, funnel steps, definitions and owners | So a platform change does not silently redefine a conversion |
| Research file | Findings with the evidence attached, by journey and segment | So a hypothesis can be traced to its source |
| Hypothesis backlog | Scored, cited and owned, with the tested items marked | So the next quarter starts from a rank rather than from a blank page |
| Wins log | Every test with its hypothesis, result, effect size, segments and decision | So the losses are as available as the wins, which is what makes the programme credible |
| Test template and QA checklist | The build and verification steps | So a new joiner runs a valid test on the first attempt |
| Roadmap | The next two quarters, ranked with the reasoning | So the programme continues without us |
| Tooling and access register | Platforms, seats, permissions and owners | So an account is never locked behind a departed employee |
Handover includes training on the template, the QA checklist and the significance review. The measure of the engagement is not the uplift reported in week twelve; it is whether the internal team runs a valid test in month four without asking us.
Failure Modes We Are Called In To Fix
| What we find | Why it happened | What we do |
|---|---|---|
| Tests run for a year with no shipped wins | Hypotheses from best-practice lists, underpowered and stopped early | Instrument, research, and rebuild the backlog with citations and effect targets |
| A win that disappeared after launch | A novelty effect, or a variant that only won in one segment | Longer runs, segment review, and a post-launch measurement window |
| Conversion rate up and revenue flat | No guardrail metrics | Average order value, lead quality and margin added as guardrails on every test |
| Two variants tracking differently | No event-parity QA | A QA checklist that verifies events in both arms before launch |
| The whole site tested as one population | No segmentation | Device, source and journey segments defined, and the baseline re-read per segment |
| A redesign shipped without a test | Pressure to launch | A staged rollout with measurement, or a declared redesign test with its attribution cost accepted |
| Learning left with the agency | No wins log | A wins log with effect sizes and a roadmap, handed over and trained |
| Speed and stability ignored | Treated as engineering work | Performance measures added to the baseline and to the guardrails |
Conversion Optimisation and the Rest of the Stack
Conversion rate is the multiplier on every other channel’s spend, so it is planned with the channels that send the traffic and the systems that record the result.
- Analytics & Attribution (GA4) Services — the events, goals, funnels and segments the whole discipline is built on.
- UI/UX Design & Consulting Services — the design work that a test hypothesis turns into a variant.
- Core Web Vitals Optimisation Services — the speed and layout stability that Figure 1 shows contributing 14 per cent of recorded uplift.
- Website Design & Development Services — the templates and build quality that decide how cheaply a variant can be produced.
- E-commerce Development & Marketing Services — the checkout, catalogue and payment paths where most retail uplift is found.
- Google Ads Management Services — the paid traffic whose cost per conversion the programme reduces.
- Data Science & Analytics Services — the statistics behind sample size, significance and segmentation.
- Search Engine Optimisation (SEO) Services — the organic landing pages and the intent match that determines the starting conversion rate.
- Marketing Automation (HubSpot & Marketo) Services — what happens to a lead after the form, which is part of the journey under test.
- BI Dashboards & Reporting Services — the reporting layer that carries the wins log into the management meeting.
Evidence From Our Work
The engagements and writing below are published on this site, each described by the subject its own page documents. They are listed because conversion work is usually commissioned by a business that can see traffic arriving and cannot see why it leaves.
- Landing page optimisation: how to convert more visitors into customers — the page-level levers, their evidence and the order in which they are worth testing.
- WordPress WooCommerce e-commerce development for Suri Retail Group — a multi-brand retail checkout and catalogue where the conversion path is the commercial asset.
- Ez1.in Services: a ground-up e-commerce platform rebuild — a journey designed from scratch, where the funnel steps were instrumented as they were built.
- A PHP build for a dance and film studio — a service business whose conversion is a booking, with the enquiry path as the subject of the work.
- Website speed optimisation checklist — the performance work behind the speed and layout-stability share of uplift in Figure 1.
- Why page speed still matters — the evidence connecting load time and stability to abandonment.
- Marketing attribution models: how to choose the right one — how a conversion is counted, which decides what a test is measuring.
- Google Search Console for business owners — the query and landing-page data that shows which pages arrive with which intent.
- Why small businesses need a professional website — what a small business’s site has to do before optimisation is worth running on it, and where research substitutes for statistical power.
- The website strategy insight archive — further writing on pages, journeys and measurement.
Frequently Asked Questions About Conversion Rate Optimisation
What conversion rate should we be aiming for?
There is no useful universal number, because the rate depends on the traffic source, the price and the commitment being asked for. The useful comparison is your own rate by device, source and segment, and the gap between the best and worst of those. We baseline that first; a target set from an industry average is a target set from somebody else’s traffic.
How much traffic do we need to run tests?
Enough to detect the smallest effect worth shipping inside a tolerable duration, which is a calculation from your baseline rate and volume rather than a rule of thumb. Many sites do not have it, and for those we say so and run a research-led programme with larger, bundled changes instead of underpowered tests reporting noise as wins.
How long does a test take?
As long as the sample size calculation says, plus enough time to pass the novelty effect and cover a full weekly cycle. Stopping early because a result looks good is the most common way a programme produces wins that disappear after launch.
What should we test first?
Where Figure 1 says the uplift is: the pricing and offer framing, then the form. Businesses usually start with headline wording, which contributed 9 per cent of recorded uplift in our programmes and is the cheapest thing to argue about.
Do you change the design or the copy?
Both, and neither is the point. The point is the barrier the research identified. Sometimes the fix is a field removed, a guarantee stated, a button that stops moving, or a price shown earlier. Design and copy are the instruments, not the objective.
What if a test loses?
It is recorded in the wins log with its effect size and segments, because a loss is evidence about the customer that the business did not have before. Roughly half of honestly designed tests do not win, and a programme that reports only wins is not reporting tests.
How do you avoid breaking the site?
With a quality-assurance checklist per variant: every device and browser in scope, the same events firing in both arms, no layout shift introduced, and a rollback path tested before launch. A variant that tracks differently produces a result that is confidently wrong.
Does page speed really affect conversion?
Yes, and it accounted for 14 per cent of recorded uplift in Figure 1 — more than copy clarity. The mechanism is usually cumulative layout shift and interaction delay rather than total load time: a button that moves under a thumb produces an abandonment that analytics records as indifference.
Can you optimise a B2B site that gets ten enquiries a month?
Not with a testing programme. At that volume we instrument the journey, research the barriers through recordings, support logs and sales feedback, test the enquiry form and the qualification path where the volume allows, and use usability sessions for everything else. We would rather say that than run tests that cannot reach significance.
What is the difference between CRO and user experience design?
Experience design decides what the page should be; conversion optimisation tests what the page is against evidence. They overlap heavily and we run them together, but a redesign shipped without measurement is a design decision, not an optimisation, and we label it as such.
How do we keep the wins after you leave?
Through the wins log, the roadmap, the test template, the QA checklist and training. The measure of the engagement is whether your team runs a valid test in month four without us, which is why handover is a scheduled workstream in Figure 3 rather than a final meeting.
What does it cost?
Quoted against the number of journeys under test, the traffic available and the tooling required. A twelve-week engagement with two test waves is a fixed fee; a standing programme is monthly and banded by test volume. There is no percentage of revenue from the wins, because that would make an inflated reading of every test financially attractive.