
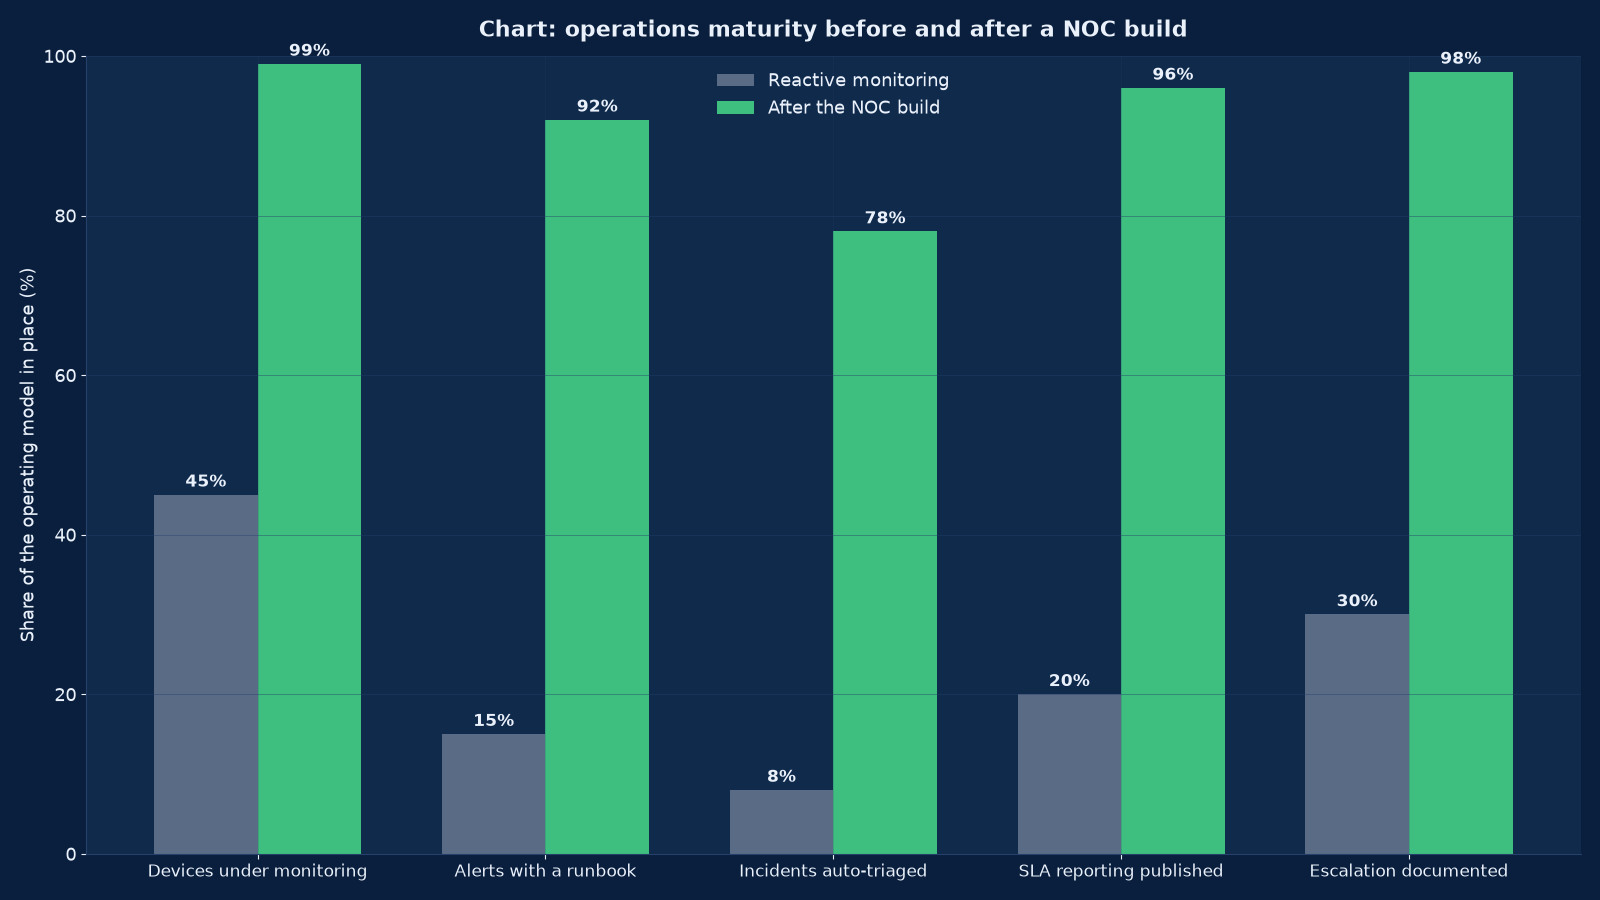
Chart values are an illustrative planning model based on typical UMC engagements and published industry benchmarks. They are not a guarantee of results on any specific project.
An operations centre is not a wall of screens. It is a decision about what deserves human attention at three in the morning, and the discipline to make everything else wait until it does. Estates do not fail because nobody was watching. They fail because too much was being watched, all of it looked equally urgent, and the one alert that mattered arrived in a queue of four hundred that did not.
Network operations centre design and monitoring engineering at Unified Management Consulting is the discipline of making an enterprise infrastructure estate observable, alertable and operable. It covers what is monitored and by which mechanism, how telemetry is collected and retained, which conditions deserve an alert and which deserve only a record, what the response to each alert is, how incidents are triaged and escalated, how the operating model is staffed across the hours the business actually needs, and how performance is reported in terms the business recognises rather than in terms the tools produce.
We build these functions for organisations whose infrastructure has outgrown the way it is watched: estates where faults are reported by users rather than detected by monitoring, where the alert volume has grown until nobody reads it, where knowledge of the estate lives with two individuals, where there is no published measure of availability or response, and where the difference between an incident and a normal Tuesday cannot be explained to a board. The work is partly technical and largely organisational, and the technical part is the easier half.
📡 NOC & Network Monitoring — Quick Summary
| Component | What We Deliver |
|---|---|
| Operations assessment | What is monitored today, what is missed, what alerts are produced, what happens to them, and a scored maturity baseline rather than a list of complaints. |
| Monitoring architecture | The collection model — agent, agentless, flow, telemetry streaming, synthetic — chosen per device class and per measurement need. |
| Device and service inventory | Everything that has to be monitored, enumerated by class, with the measurement appropriate to each. |
| Alert design and thresholds | Which conditions alert, at what threshold, to whom, with what severity — and, just as importantly, which conditions are recorded without alerting. |
| Runbook engineering | A written response for every alert, including the diagnostic steps, the escalation trigger and the evidence to capture. |
| Event correlation and noise reduction | Grouping related events into one incident, suppressing the consequences of a known cause, and reducing alert volume without losing coverage. |
| Automated triage and remediation | The diagnostics and fixes that can safely run without a human, and the boundary beyond which automation must stop. |
| Escalation and on-call model | Who is called, in what order, with what authority, and what happens when nobody responds. |
| Service-level design and reporting | The measures the business is reported against, the measurement method behind each, and the reporting cadence. |
| Tooling selection and integration | Platform choice against the estate’s actual needs, plus integration with ticketing, directory and change systems so the operations record is complete. |
| Capacity and trend analysis | The measurements that predict an outage rather than report one, with forecast points at which action is required. |
| Operations handover and training | The runbooks, the shift model, the training and the performance baseline the receiving team inherits. |
A Network Operations Centre Is Not a Service Desk
There are two functions that get conflated because both answer a telephone, and conflating them produces a service desk that cannot fix infrastructure and an operations centre that spends its shifts resetting passwords. They are different work with different skills, different measures and different escalation paths.
| Dimension | Service desk | Network operations centre |
|---|---|---|
| Triggered by | A user reporting a problem | A condition detected by monitoring, before or without a user reporting it |
| Unit of work | A ticket raised by a person | An event from the estate, which may or may not have a ticket yet |
| Primary skill | Breadth across user-facing systems, communication, triage speed | Depth across infrastructure: network, platform, storage, and the ability to diagnose from telemetry |
| Success measure | First-contact resolution, response time, user satisfaction | Mean time to detect, mean time to acknowledge, mean time to resolve, and the number of incidents detected before users noticed |
| Working pattern | Business hours plus cover, with volume following the working day | Continuous where the estate requires it, with volume following the estate rather than the working day |
| Escalates to | Infrastructure operations, application teams, vendors | Specialist engineers, vendors, and the incident management process |
| What it must not do | Attempt deep infrastructure diagnosis, which consumes the queue | Absorb user-reported volume that belongs in the service desk, which consumes the shift |
| Relationship | Raises incidents to the operations centre when a user report indicates an infrastructure fault | Notifies the service desk when an infrastructure fault will generate user reports, so the desk is not discovering it repeatedly |
The relationship in the last two rows is the one most estates do not have, and its absence is expensive in a specific way: an infrastructure fault generates forty user tickets, each of which is triaged separately by people who cannot see the common cause. Our IT Help Desk & End-User Support Services is the user-facing function; this page is the estate-facing one, and the two share an incident record so a fault is worked once rather than forty times.
Maturity Assessment: Five Measures That Can Actually Be Moved
A maturity assessment has to produce numbers, because “our monitoring is poor” cannot be scheduled, funded or improved. The five measures below are the ones we score, and they are chosen because each is measurable, each predicts incident severity, and each can be moved by a specific piece of work.
| Measure | What it means | Why it predicts outcome | Typical starting position |
|---|---|---|---|
| Devices under monitoring | The share of the inventoried estate producing telemetry | An unmonitored device is a fault that will be reported by a user, which means detection time equals complaint time | Rarely above half, because the inventory itself is usually incomplete |
| Alerts with a runbook | The share of alert types with a written response | An alert with no runbook depends on whoever is on shift knowing what it means, which is a knowledge concentration risk | Very low — the commonest gap, and the cheapest to close |
| Incidents auto-triaged | The share of incidents whose first diagnostic steps ran without a human | Determines whether the human time is spent diagnosing or deciding, and it is the difference between a team of three and a team of nine | Near zero, since automation is usually retrofitted rather than designed |
| Service-level reporting published | Whether availability and response are measured, reported and reviewed | An estate that does not publish its performance cannot improve it deliberately, and cannot defend it either | Often absent, or published from tool defaults rather than from a designed measure |
| Escalation documented | Whether the escalation path, authority and timing are written down and known | Decides how long a serious incident waits for the right person, which is frequently longer than the diagnosis takes | Partially documented, and dependent on individuals rather than on the process |
The baseline is re-measured, not re-argued
Those five measures are recorded at the start of an engagement and re-measured at handover, which is what Figure 1 reports. The reason to insist on measurement rather than narrative is that operations improvement is invisible in the moment: an estate that gets better produces fewer incidents, and fewer incidents look like less work rather than like success. Without a baseline, the improvement cannot be demonstrated to the people who funded it.
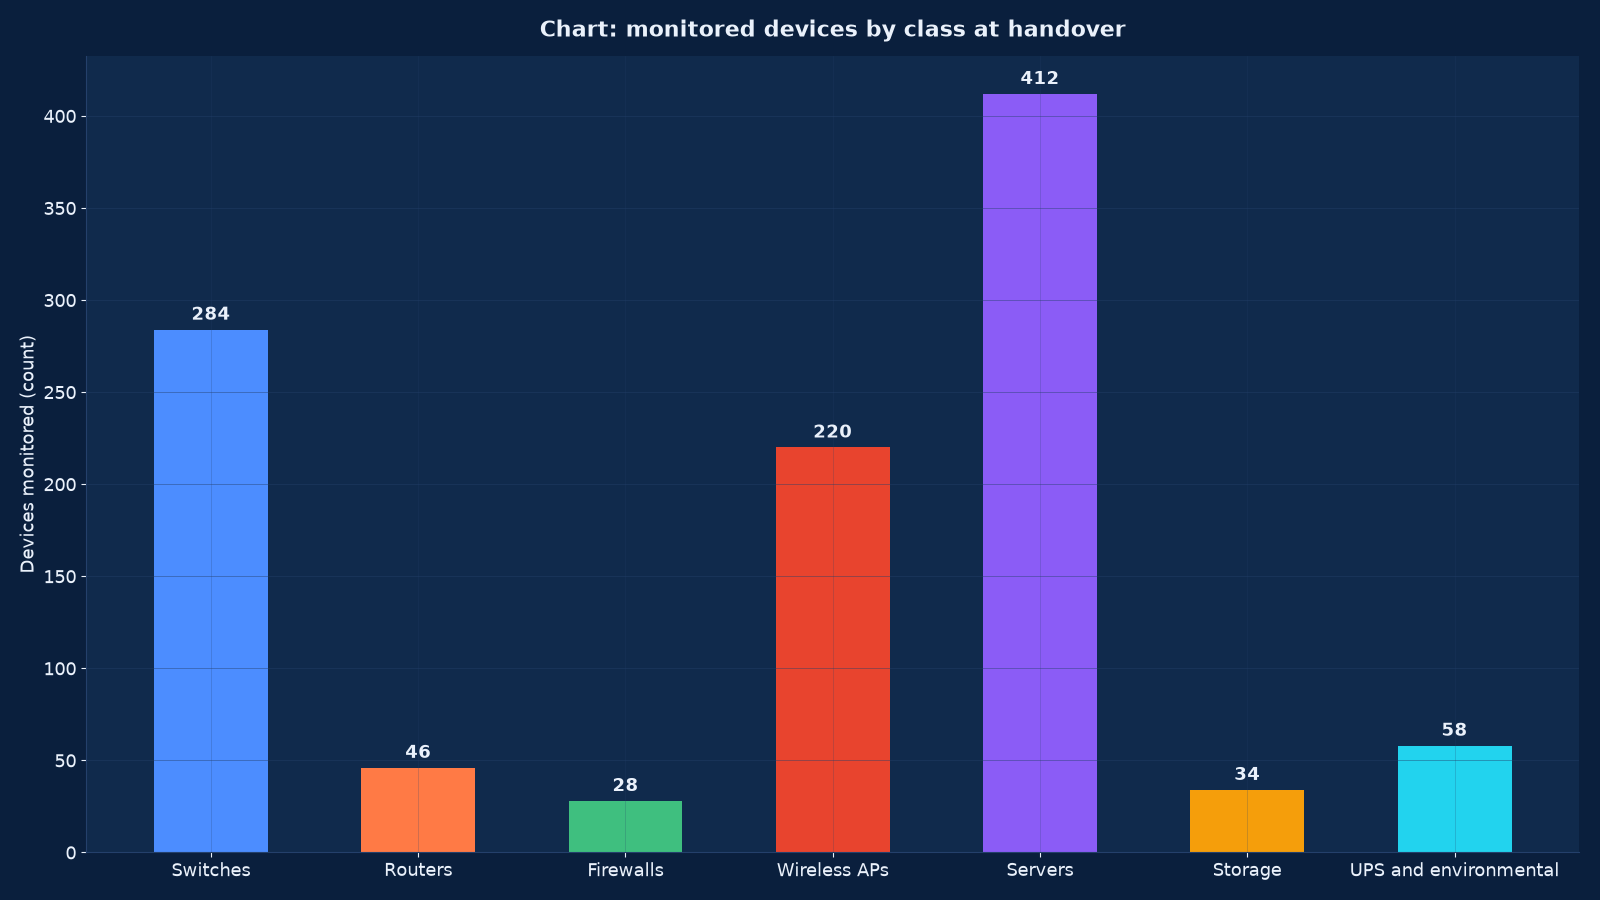
Chart values are an illustrative planning model based on typical UMC engagements and published industry benchmarks. They are not a guarantee of results on any specific project.
Monitoring Architecture: Seven Collection Methods, and What Each Can See
Monitoring architecture is the choice of how telemetry is obtained, and it differs per device class because the classes differ in what they can produce. An architecture that assumes one method across the estate either misses whole classes or generates volume it cannot store.
| Method | What it produces | Applied to | The limitation |
|---|---|---|---|
| Polling — Simple Network Management Protocol | Interface counters, status, basic utilisation and error rates at a polling interval | Switches, routers, firewalls, power and environmental devices | Interval-bounded, so short faults are missed; and it reports state, not cause |
| Agent-based collection | Process-level detail, resource utilisation, service state and application behaviour | Servers, platforms, and anything with an operating system to run the agent | An agent estate to deploy, upgrade and secure — and agents fail silently |
| Streaming telemetry | Continuous high-resolution counters pushed by the device | Modern network equipment where the platform supports it | Volume, and a collector that has to be sized for it |
| Flow records | Session-level traffic data: who talked to whom, on what, for how long | Routers, switches and firewalls, for traffic analysis and security investigation | No application-level content, and sampling means it is statistical rather than exact |
| Synthetic testing | Actively measured availability, latency and transaction success from a user-like position | Critical services, and paths whose quality users judge rather than devices report | Only tests what it is written to test, so coverage has to be designed deliberately |
| Log collection | Event and error records from devices, platforms and applications | Everything, and it is the only source that explains cause | Volume, retention cost, and the need for parsing before it is useful |
| Environmental and power monitoring | Temperature, humidity, water detection, power state, battery health | Facility and room infrastructure, which is where network outages frequently originate | Commonly omitted from network monitoring entirely, so the cause is invisible |
The environmental row is the one that surprises people. A substantial share of network outages originate in a room rather than in a device — a cooling failure, a power event, a leak — and estates that monitor the network without monitoring the room diagnose those incidents from symptoms alone. Figure 2’s fifty-eight power and environmental devices are monitored for that reason, and their telemetry is correlated with the network’s rather than held separately.
Alert Design: What Deserves Human Attention at Three in the Morning
Alert design is the heart of an operations centre, and it is almost always wrong in the same direction: too many alerts, each individually reasonable, which together produce a queue nobody reads. The discipline is to decide what deserves human attention before deciding what deserves recording.
| Principle | What it means in practice | The failure it prevents |
|---|---|---|
| Alert on outcome, not on symptom | Alert when a service or path is degraded, not when an individual counter moves | An interface error rate alerting on a link that is not carrying anything important |
| Every alert has a runbook | A written response: the diagnostics, the likely cause, the escalation trigger, the evidence to capture | An alert that depends on the knowledge of whoever happens to be on shift |
| Every alert has an owner | A named role, not a distribution list | An alert that everybody sees and nobody acts on, which is the definition of an unowned alert |
| Severity means something | A small number of severities with defined response times and escalation, applied consistently | Everything marked urgent, which means nothing is |
| Thresholds are set from data | Baseline behaviour measured, then the threshold set outside normal variation | Vendor default thresholds, which are tuned for no estate in particular |
| Some conditions are recorded without alerting | Trends and anomalies captured for analysis rather than for immediate response | Every observation becoming an interruption, which is how alert fatigue starts |
| Alerts are reviewed and retired | A periodic review of what alerted, what was acted on and what was noise | Alert volume growing monotonically, which it does unless somebody owns reducing it |
| Correlation is designed, not hoped for | Related events grouped by topology and by cause, with consequences of a known fault suppressed | One failed switch producing four hundred alerts, of which the first was the only useful one |
The target is a queue a human can finish
The practical test of an alert design is whether one person on one shift can work the queue to empty. If they cannot, the design is wrong regardless of how individually sensible each alert seemed. We size the alert volume against the shift model as part of the design, and we report the achieved volume at handover, because an operations centre whose queue is structurally unfinishable will produce missed incidents however well it is staffed.
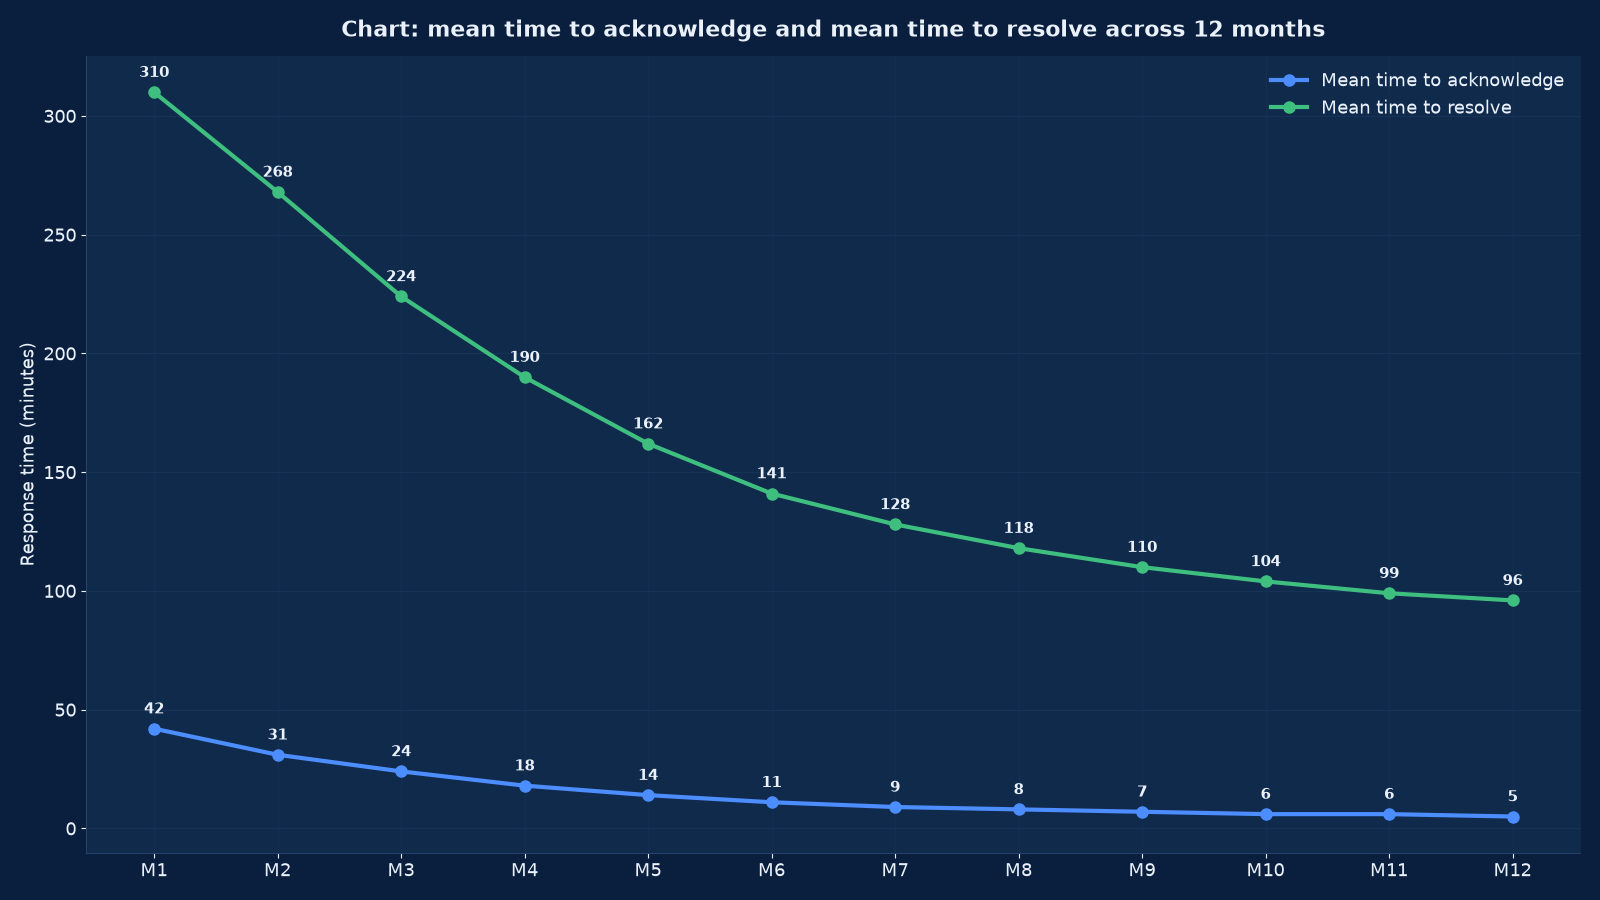
Chart values are an illustrative planning model based on typical UMC engagements and published industry benchmarks. They are not a guarantee of results on any specific project.
Incident Handling: Where the Time Actually Goes
Incident handling is the process the alerts feed into, and its design determines whether detection turns into resolution or into a queue. The stages below are the ones that have to be explicit, because each is a place where time is lost silently.
| Stage | What has to be true | Where time is lost without it |
|---|---|---|
| Detection | A condition is detected by monitoring rather than reported by a user | Detection time equal to complaint time, which is measured in tens of minutes to hours |
| Acknowledgement | Somebody owns the incident within a defined time | An alert sitting in a queue while everyone assumes somebody else is looking at it |
| Triage | The scope and severity are established quickly, using automated diagnostics where they exist | A human repeating the same ten diagnostic steps for every incident, which is where most resolution time actually goes |
| Correlation | Related events are recognised as one incident rather than worked separately | Several people investigating one fault from different symptoms, and nobody seeing the whole of it |
| Diagnosis and fix | The runbook is followed, or the incident is escalated to somebody who can go beyond it | An on-shift operator attempting a diagnosis the runbook says should be escalated |
| Escalation | A defined path with a defined trigger and a defined time, to people with the authority to act | Escalation by seniority rather than by trigger, which means waiting until somebody gives up |
| Resolution and verification | The service is verified as restored by measurement, not declared restored by the absence of complaints | An incident closed while the underlying condition persists, producing a repeat |
| Record and review | The timeline, cause and actions are recorded; significant incidents are reviewed | The same incident recurring, because the cause was fixed in the tool and never in the design |
Mean time to acknowledge and mean time to resolve are reported separately for exactly this reason. They improve for different reasons and they are fixed by different work: acknowledgement by routing and on-call design, resolution by runbooks and automation. An estate that reports only one number cannot tell you which half of its process is broken.
Automation: Diagnose Freely, Remediate Narrowly, Never Decide
Automation is what allows a small team to operate a large estate, and the boundary of what may be automated is a design decision with consequences rather than a technology question. The pattern is consistent: automate diagnosis freely, automate remediation narrowly, and never automate a decision that requires business context.
| Automation tier | What runs without a human | Guard rails | The risk of going too far |
|---|---|---|---|
| Automated diagnostics | The first ten checks on any incident: device reachability, interface state, recent changes, related events, capacity position | Read-only, with results attached to the incident record | Minimal — this tier should cover almost everything |
| Automated enrichment | Correlating events, identifying the affected services and users, and attaching the relevant runbook | Correctness verified periodically, since a bad correlation misdirects the responder | Low, but a wrong enrichment is worse than none because it is believed |
| Automated notification | Informing the right people and the service desk, and suppressing duplicate user-facing messages | Routing tested, with a fallback if the notification path itself fails | Low |
| Automated remediation — bounded | Defined, reversible fixes: clearing a stuck session, failing over to a redundant path, restarting a service with a known safe restart procedure | Rate-limited, reversible, logged, and disabled automatically after repeated attempts on the same target | Moderate — a remediation loop can convert one fault into a wider one |
| Automated remediation — unbounded | Anything that changes configuration, capacity or state without a defined limit | Should not exist without a change process behind it | High, and the failure mode is an automated action taken during an incident that makes the incident worse |
| Automated business decisions | Anything requiring judgement about consequence — failing over a production system, shutting a service, invoking a recovery | Never fully automated; automated preparation with a human authorisation | Severe, because the automation cannot know what the business is doing at that moment |
Seventy-eight per cent of incidents auto-triaged, which is what Figure 1 reports at handover, means the human shift begins with a diagnosis already assembled rather than with a bare alert. That is the change that makes the resolution-time improvement in Figure 3 possible, and it is achievable without giving automation any authority to alter the estate.
Coverage and the Shift Model: Matching the Estate’s Real Requirement
The shift model is the part of an operations centre design that is treated as an administrative detail and is actually a design constraint. Coverage has to match the estate’s real requirement, and the requirement is set by what the business loses per hour of downtime, not by convention.
| Model | Coverage | Suits | The cost and the risk |
|---|---|---|---|
| Business hours with on-call | Monitored cover during working hours, with an on-call rotation outside them | Estates whose out-of-hours impact is low and whose systems tolerate delay | On-call fatigue, and a detection-to-response gap outside hours that is longer than the design assumes |
| Extended hours | Coverage across the working day plus the evening peak | Retail, hospitality and consumer-facing estates whose peak is outside office hours | A gap overnight, which has to be a deliberate and documented acceptance |
| Continuous in-house | Twenty-four-by-seven coverage by the organisation’s own team | Estates where an hour of downtime is materially expensive, or where a safety or regulatory obligation exists | The real cost of a minimum viable continuous team, which is larger than most estimates because shifts, leave and training have to be covered |
| Continuous managed service | Twenty-four-by-seven coverage provided externally, escalating to the organisation for authorised actions | Estates that need continuous coverage but cannot justify or recruit a team for it | Dependence on the provider’s runbook quality, and a handover boundary that has to be explicit |
| Follow-the-sun | Coverage handed between geographically separated teams | Organisations with infrastructure teams in more than one time zone | Handover quality, which is where incidents are lost — and it requires disciplined documentation rather than a shift change conversation |
| Hybrid | Continuous monitoring with automated triage, and human response only above a severity threshold | The commonest real answer, and the one automation makes viable | The threshold decision, which has to be reviewed as the estate changes |
Knowledge concentration is a coverage risk
An estate that can only be diagnosed by two people is not covered twenty-four hours a day however many shifts are rostered. Runbooks exist for this reason: they move knowledge out of individuals and into the function. We measure runbook coverage per alert type and we write the runbooks with the people who currently hold the knowledge, which is slower than writing them from documentation and produces runbooks that actually work.
Service-Level Reporting: Measures the Business Recognises
Service-level reporting is how an operations function is judged by people who will never look at a monitoring platform, and most estates report the wrong things because they report what the tools produce. A measure is only useful if the business recognises the outcome it describes.
| Measure | How it is defined | Why the naive version misleads |
|---|---|---|
| Service availability | The share of time a defined service was available, measured from the user’s position rather than the device’s | Device availability says a switch was up; service availability says users could work, and they differ constantly |
| Mean time to detect | From condition arising to the estate knowing | Often unmeasured, because the start of the interval is hard to establish — which is exactly why it matters |
| Mean time to acknowledge | From alert to a named owner | Conflated with detection, which hides whether the problem is monitoring or routing |
| Mean time to resolve | From detection to verified restoration | Measured to closure rather than to restoration, which includes administrative time nobody experiences |
| Incidents detected before user report | The share of incidents monitoring found first | The single most meaningful measure of whether monitoring works, and the one most estates do not collect |
| Alert volume and actionability | How many alerts, and what share resulted in an action | Volume alone is meaningless; a low volume of unactionable alerts is worse than a high volume of actionable ones |
| Change-related incidents | Incidents whose cause was a change | Reveals whether the change process is the problem, which it usually is |
| Capacity forecast accuracy | Whether predicted exhaustion dates matched reality | An unmeasured forecast is a guess with a dashboard, and the emergencies come from the difference |
| Runbook coverage | The share of alert types with a written response | The leading indicator of everything above, and the cheapest to improve |
We agree the measure set with the business before building the reporting, because a report that answers the operations team’s questions and not the board’s will not be read. The reporting is published on a defined cadence and reviewed, and the review is where the thresholds and the alert design get corrected against what the numbers actually showed.
Tooling: Requirements Before Platforms
Tooling choice follows from the estate rather than preceding it, and the commonest mistake is selecting a platform before deciding what has to be measured. The requirements below are the ones that determine whether a platform will still be usable in three years.
| Requirement | What to establish before choosing | The consequence of getting it wrong |
|---|---|---|
| Collection coverage | Whether the platform can collect from every device class in the estate, including the environmental and power devices | Whole classes monitored by a second tool, which means two places to look during an incident |
| Volume and retention | Telemetry volume at full coverage, and how long it has to be retained for investigation and trend analysis | A platform that works at partial coverage and degrades at full coverage, discovered after deployment |
| Correlation capability | Whether it can group events by topology and by cause, and suppress consequences of a known fault | A queue of individual alerts instead of a queue of incidents, which is the noise problem in a new interface |
| Runbook and automation support | Whether responses and diagnostics can be attached to alert types and executed safely | Automation living outside the platform, disconnected from the incident record |
| Integration | Ticketing, directory, change management and notification paths | An operations record that is incomplete, so incidents cannot be reconstructed |
| Reporting flexibility | Whether the measures the business wants can be produced, rather than the measures the platform defaults to | Reporting done outside the platform in a spreadsheet, which decays immediately |
| Administration cost | What it takes to keep the platform correct as the estate changes | A tool that becomes stale because maintaining it is somebody’s unpaid second job |
| Vendor viability and exit | Licence model, renewal exposure and whether telemetry can be exported | An estate whose operational history is trapped in a platform whose renewal price rises |
Where an estate already runs a platform, the more common and more useful engagement is to make the existing one work: complete the inventory, add the missing device classes, write the runbooks, design the correlation and fix the thresholds. Replacing a tool because it is producing noise usually reproduces the noise in a different interface.
Capacity and Trend Analysis: Preventing the Incident Nobody Alerts On
Capacity and trend analysis is the part of monitoring that prevents incidents rather than responding to them, and it is the part most estates do not do because it produces no alerts and therefore no visible value until the emergency it did not have.
| What is trended | The forecast it produces | The action it triggers in advance |
|---|---|---|
| Interface and link utilisation | The date a link exhausts its capacity at current growth | A capacity upgrade ordered before users experience degradation |
| Storage consumption | The date a volume or target fills | An extension or a tiering decision made with time to choose rather than under pressure |
| Compute and memory utilisation | The date a cluster or host reaches its ceiling | A node addition or a workload placement change scheduled deliberately |
| Backup window duration | The date the window no longer fits | A change to the backup design before protection starts failing silently |
| Power and cooling load | The date a room reaches its capacity | A facility decision made with lead time, which for cooling equipment is long |
| Alert and incident volume | Whether the operating model is still sized for the estate | A shift model or automation change before the team starts missing incidents |
| Certificate and licence expiry | The date an expiry will break something | Renewal completed before an outage caused by an administrative deadline |
| Support and firmware lifecycle | The date a platform leaves support | A refresh programme funded in a budget cycle rather than in an emergency |
Each of these produces a date, and a date is a schedulable item. That is the difference between an estate that buys capacity in a budget cycle and one that buys it in an emergency at a premium with no time to choose — and it requires no technology the estate does not already have, only the decision to look at the trend rather than at the current value.
How This Differs From Our Neighbouring Pages
An operations centre sits on top of the entire estate and feeds the functions around it. These are the relationships that have to be designed rather than assumed.
| Your question | Right starting point | What it produces |
|---|---|---|
| Faults are reported by users before we detect them | This page | A monitoring architecture, an alert design with runbooks, and a scored maturity baseline that moves |
| Who designs the network being monitored? | Routing, Switching, Firewall and Network Engineering | The network architecture whose telemetry this function consumes, including the SNMP, flow and streaming capability the design has to specify |
| Users raise tickets for infrastructure faults | IT Help Desk & Remote Support Services | A shared incident record and a notification path, so one fault is worked once rather than forty times |
| Application and platform reliability is the real concern | Site Reliability Engineering (SRE) & Observability | An observability model for services, with error budgets and the service-level objectives that network monitoring feeds |
| Deployment and change are causing the incidents | DevOps & CI/CD Engineering Services | A change process integrated with monitoring, since change-related incidents are usually the largest category |
| Cloud estates need the same visibility | Cloud Services & Migration — AWS, Azure and Google Cloud | A monitoring model spanning cloud and on-premises, with one incident process across both |
| The physical plant and rooms are the source of faults | Our structured cabling and LAN/WAN engineering offering, built in this same programme | An asset register and topology that monitoring depends on to correlate an event with a service |
| Wireless degradation is invisible until users complain | Our enterprise wireless offering, built in this same programme | Radio-level telemetry — client counts, retries, channel utilisation — with thresholds against a validated baseline |
| Sites are distributed and connectivity varies | Our SD-WAN and SASE offering, built in this same programme | Per-path quality telemetry, which is what makes a site connectivity fault diagnosable from the centre |
| Who operates it once it is built? | Managed IT Infrastructure & IT AMC Services | A managed service running the operating model, thresholds and runbooks this page specifies |
| An auditor wants evidence about our operations | IT Audit, Compliance & ISO 27001 / SOC 2 Readiness | The incident records, escalation evidence, change correlation and published service-level reporting |
Evidence From Our Work
Continuous operations is the environment this discipline exists for, and the engagements below are estates where monitoring was a contractual or commercial requirement rather than a good intention: twenty-four-by-seven media operations, multi-property hospitality with guest-facing connectivity, and multi-site clinical networks.
- IT Infrastructure Management for an IT Company — Case Study — recorded on the site under the client-facing title IT Infrastructure Management for Star TV. The scope is twenty-four-by-seven proactive monitoring, remote and on-site support, preventive maintenance and security management for a media and broadcasting company, on a twenty-four month renewable contract, documented at 1,181 words. Continuous broadcast operations are the clearest possible case for a designed operations centre: there is no acceptable window in which a fault is discovered by a user.
- Marriott Hotel Hyderabad — Case Study — managed services, monitoring and maintenance across multi-property hospitality operations, where guest-facing connectivity is a commercial product and its degradation is reported by guests rather than by devices.
- Global Hospitals — Case Study — a multi-location healthcare network with a server room build and twenty-four months of support, where clinical systems have availability expectations that make detection time a clinical matter.
- Fern Hotel Hyderabad — Case Study — hospitality infrastructure across properties, which is the distributed-estate pattern where a central operations function replaces site-by-site reliance on whoever is available.
- Apollo Hospitals — Case Study — a measured multi-campus feasibility assessment, which is the same method monitoring design uses: establish the baseline by measurement, then set thresholds outside normal variation rather than from a vendor default.
- AI Transformation Strategy for Modern Industries — how automation and machine-assisted triage are changing operations functions, and which parts of the shift remain human decisions.
- Enterprise Computer Networks: Trends, Operations, and Careers — the operations discipline itself, including what it takes to staff a continuous function and why runbook coverage is the leading indicator of everything else.
- our Technology archive — further writing on operations, observability and infrastructure management.
Frequently Asked Questions About NOC and Network Monitoring
How is a network operations centre different from a service desk?
By what triggers the work and what it is measured on. A service desk is triggered by a user reporting a problem and is measured on response time, first-contact resolution and satisfaction. An operations centre is triggered by a condition detected in the estate and is measured on time to detect, acknowledge and resolve, plus the share of incidents found before any user noticed. They need different skills and they should share one incident record, so an infrastructure fault is worked once rather than forty times from forty user tickets.
What should we monitor first if our coverage is incomplete?
By consequence rather than by ease. Start with the devices and paths whose failure stops the business — core and distribution network equipment, the power and environmental devices in the rooms that hold it, the services users depend on measured synthetically from a user-like position, and the capacity measures that predict an outage. Estates usually monitor servers first because servers are easy, and discover that their outages originate in a room.
Why do we get so many alerts and act on so few?
Because the alerts were designed individually and never as a set. Each seemed reasonable, and together they exceed what one person on one shift can work. The fix is a design principle rather than a filter: alert on outcome not symptom, set thresholds from measured baselines rather than vendor defaults, correlate related events into one incident, suppress the consequences of a known cause, record trends without alerting on them, and review the queue periodically to retire what produced no action.
What is a runbook and how detailed should it be?
A written response for a specific alert type: the diagnostics to run, the likely causes in order, the fix for each, the point at which to escalate and to whom, and the evidence to capture. It should be detailed enough that a competent operator who has never seen this alert before can work it, and short enough to be used during an incident rather than studied. We write them with the people who currently hold the knowledge, which is the only way to capture the parts that are not in any documentation.
How much can be automated safely?
Diagnosis almost entirely; remediation narrowly; business decisions never. Automated diagnostics are read-only and should cover the first ten checks on every incident. Automated remediation should be limited to defined, reversible actions, rate-limited, logged, and disabled after repeated attempts on the same target. Anything requiring judgement about consequence — failing over a production system, shutting a service, invoking a recovery — is automated preparation with human authorisation.
What response times should we commit to?
Set by the business consequence per severity, not by what the team currently achieves, and then made achievable by the design. A useful structure is a small number of severities with defined acknowledgement and resolution targets and a defined escalation trigger for each. Committing to a target the operating model cannot meet produces a report nobody believes; committing to none produces an estate where every incident waits for whoever notices it.
Do we need twenty-four-by-seven coverage?
Only if the cost of an hour of undetected fault justifies it, which is a business calculation rather than a technical preference. The real cost of a minimum viable continuous in-house team is larger than most estimates, because shifts, leave and training all have to be covered. The commonest workable answer is continuous monitoring with automated triage and human response above a severity threshold, which automation has made viable for estates that could not previously justify a team.
How do we monitor cloud and on-premises in one place?
Through one incident process rather than necessarily one tool, although one tool is preferable. What has to be unified is the inventory, the severity definitions, the escalation path and the reporting — so that an incident affecting a service delivered partly from cloud and partly on-premises is worked as one incident by one team with one record. Two monitoring platforms with no shared incident model produce two teams each certain the fault is in the other’s estate.
What telemetry retention do we need?
Long enough to investigate an incident discovered late and to establish a trend, which usually means high-resolution data for days to weeks and lower-resolution or aggregated data for months to years. Retention is a cost decision driven by investigation need rather than by storage capacity, and flow and log data dominate it. The trend case matters as much as the incident case: a capacity forecast needs months of history, and an estate that retains only days cannot predict anything.
How do we know whether the operations centre is working?
By the measures in Figure 1 and Figure 3, trended: devices under monitoring, alerts with a runbook, incidents auto-triaged, published service-level reporting, documented escalation, and the share of incidents detected before a user reported them. That last measure is the one that matters most and the one most estates do not collect. Improvement is invisible in the moment — fewer incidents look like less work — which is exactly why the baseline has to be recorded before the programme starts.
Can we keep our existing monitoring platform?
Usually, and usually you should. The commonest reason an existing platform produces noise is not the platform: it is an incomplete inventory, missing device classes, thresholds from vendor defaults, no correlation design and no runbooks. Replacing a tool because it is noisy commonly reproduces the noise in a different interface. We establish whether the gap is capability or configuration before recommending any change.
What evidence do we get at the end of a build?
The scored maturity baseline and its re-measurement, the device and service inventory with the collection method per class, the monitoring architecture, the alert design with severity definitions and owners, the runbooks per alert type, the correlation and suppression rules, the automation boundary with its guard rails, the shift and escalation model, the service-level measure definitions and the published reporting, the capacity trend analysis with forecast dates, and the training record for the team that inherits it.
Find Out Whether Your Monitoring Detects Anything Before a User Does
That single measure settles the question of whether an operations function exists or whether it is a queue with a name. We will assess what is monitored, what alerts, what happens to those alerts and what is missed, score the five maturity measures, and give you a design with runbooks, thresholds, automation boundaries and a coverage model that can actually be staffed — plus the baseline you will need in a year to prove it worked.
Contact Unified Management Consulting to arrange a confidential first conversation.
Related Services
An operations centre consumes telemetry from everything and feeds every function around it. These are the engagements it most often runs alongside:
- Routing, Switching, Firewall and Network Engineering — the network whose telemetry this function consumes, and the design that has to specify what the equipment exposes.
- IT Help Desk & Remote Support Services — the user-facing function that shares the incident record, so a fault is worked once rather than once per ticket.
- Site Reliability Engineering (SRE) & Observability — the service-level observability model above the infrastructure layer, with the objectives and error budgets network monitoring feeds.
- DevOps & CI/CD Engineering Services — the change process that monitoring has to correlate against, since change-related incidents are usually the largest category.
- Managed IT Infrastructure & IT AMC Services — the managed service that runs the operating model, thresholds and runbooks this page specifies.
- IT Audit, Compliance & ISO 27001 / SOC 2 Readiness — the incident, escalation and change evidence an auditor will ask to see.
- Cloud Services & Migration — AWS, Azure and Google Cloud — one incident process spanning cloud and on-premises, rather than two teams each certain the fault is elsewhere.
- Enterprise Wireless & Wi-Fi 6 Design Services — predictive surveys, Wi-Fi 6 and 6E design, roaming and the coverage evidence taken on site
- Network Security, Segmentation & NAC Services — segmentation, NAC, firewall policy and the change control that keeps the boundary auditable
- SD-WAN & SASE Design and Rollout Services — SD-WAN and SASE rollout with application policy, transport independence and measurable failover behaviour
- Structured Cabling & LAN/WAN Design Services — structured cabling, containment, labelling, certification and the LAN and WAN design that runs over it
- Unified Communications & VoIP Services — unified communications and VoIP design, number planning, QoS, contact centre integration and call quality
- Computing, Server, Storage & Data Centre Engineering — the computing estate as a whole: inventory, sizing, consolidation, lifecycle, power, cooling and failover