
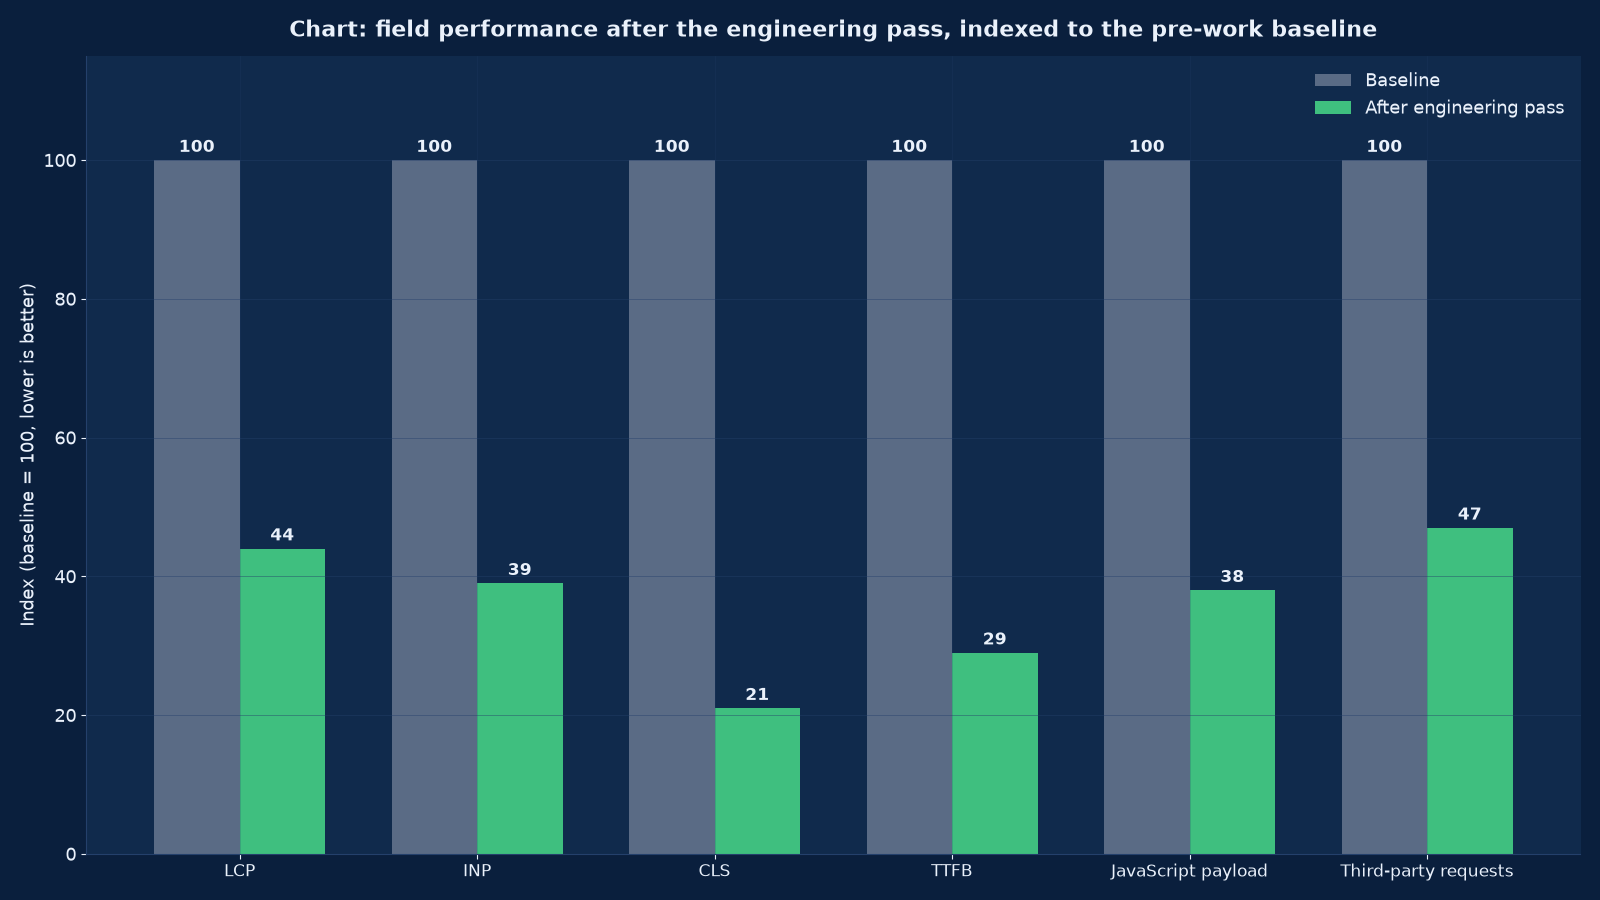
Chart values are an illustrative planning model based on typical UMC engagements and published industry benchmarks. They are not a guarantee of results on any specific project.
Speed is not a technical preference. It is the only part of the user experience that your visitors measure without being asked, on every single visit, with their own patience.
Core Web Vitals and performance engineering is the discipline of making a website fast for real people on real networks, proving it with field data rather than a laboratory score, and keeping it that way with budgets and a gate in the delivery pipeline. Unified Management Consulting runs this as an engineering engagement, not as an optimisation sprint: we instrument first, find where the milliseconds actually go, fix the delivery layer, the front end and the third-party estate, and then hand you a budget your team can hold without us.
We work on WordPress and WooCommerce estates, React and Next.js storefronts, Laravel and Java enterprise applications, headless commerce stacks, portals and marketing sites — typically when a rebuild has shipped slower than the site it replaced, when a search ranking or conversion problem has been traced to speed, when a paid-media budget is being wasted on landing pages that take six seconds to become usable, or when a tender specifies performance thresholds that the current estate cannot evidence.
⚡ Core Web Vitals & Performance Engineering — Quick Summary
| Component | What We Deliver |
|---|---|
| Field instrumentation | Real-user monitoring wired to the 75th percentile per metric, per template and per device class, with a baseline captured before any change is made. |
| Waterfall and budget diagnosis | A full request waterfall per priority template: server time, critical path, render-blocking resources, main-thread work, third-party cost and payload composition. |
| Server and delivery layer | Time to first byte reduction through caching strategy, query and object caching, edge delivery, compression, HTTP/2 or HTTP/3 and origin tuning. |
| Critical rendering path | Font strategy, critical CSS, render-blocking script removal, preload and priority hints, and a defined above-the-fold render path per template. |
| Image and media engineering | Modern formats, responsive srcset, correct sizing, lazy loading below the fold, explicit dimensions, and a media pipeline that editors cannot bypass. |
| Largest contentful paint work | Identifying the LCP element per template and removing everything that delays it — usually a font, a late image or a render-blocking stylesheet. |
| Interaction to next paint work | Main-thread reduction: code splitting, long-task elimination, deferred hydration, input-latency fixes and event-handler profiling. |
| Cumulative layout shift work | Reserved space for every dynamic element, font-swap strategy, injected-content rules and third-party slot discipline. |
| Third-party governance | A tag inventory with cost per tag, loading strategy, facade patterns for heavy embeds, and contractual terms for what may be added later. |
| Performance budgets | Named budgets per template for payload, requests, milliseconds and main-thread work, enforced in the build pipeline and reviewed per release. |
| Regression gate and monitoring | Automated lab tests on every release, field dashboards, alert thresholds and a monthly performance review with the numbers that moved. |
| Commercial reporting | The link between field metrics and conversion, bounce, ad quality score and revenue — reported against the baseline, with the instrument named. |
What Core Web Vitals actually measure, and what they do not
Three metrics carry the label, and a fourth — time to first byte — determines whether the other three are achievable at all. Each is measured at the 75th percentile of real pageviews, split by mobile and desktop, because a median hides exactly the slow devices and networks that matter most.
| Metric | What it measures | Good threshold | The usual cause when it fails |
|---|---|---|---|
| Largest Contentful Paint | When the largest visible content element — a hero image, a headline block, a video poster — finishes rendering | 2.5 seconds or less at the 75th percentile | Slow server response, a render-blocking stylesheet, a late-discovered hero image, or a web font that delays text paint |
| Interaction to Next Paint | Responsiveness: the delay between a user input and the next visual update, taking the worst interaction on the page | 200 milliseconds or less at the 75th percentile | Long main-thread tasks from JavaScript, un-split bundles, heavy hydration, unoptimised event handlers, third-party scripts |
| Cumulative Layout Shift | Visual stability: how much visible content moves unexpectedly during the page life | 0.1 or less at the 75th percentile | Images and embeds without dimensions, fonts that swap metrics, injected banners and advertising, late-loaded components above the fold |
| Time to First Byte | How long the server takes to begin responding — not a Core Web Vital, but the ceiling on all three | 600 milliseconds or less, ideally under 200 for cached pages | Uncached dynamic rendering, slow database queries, no object cache, distant origin without a CDN, plugin or middleware overhead |
What they do not measure is equally important. Core Web Vitals say nothing about whether the page is usable, accessible, secure or correct; a site can pass all three and still be a poor product. They are also field metrics, so they lag: a fix deployed today appears in Search Console data over roughly 28 days, which is why we instrument our own real-user monitoring and judge releases on that rather than waiting for a search report to catch up.
Field data versus lab data: why both, and which decides
Every performance argument we have ever witnessed in a client office was caused by somebody quoting a lab score at somebody else quoting field data. Both are real measurements of different things, and a programme needs both with the roles clearly assigned.
| Dimension | Lab data (Lighthouse, WebPageTest, synthetic) | Field data (CrUX, real-user monitoring) |
|---|---|---|
| What it measures | A controlled run on a defined device, network and cache state | The actual experience of your actual visitors across every device and network |
| Reproducibility | High — the same commit produces the same result | Low per session, high in aggregate at the 75th percentile |
| Speed of feedback | Immediate, on every build and pull request | Days to weeks; a rolling window |
| Coverage | Only the pages and templates you test | Every page your users visit, including the ones nobody remembers |
| Diagnostic value | Excellent — full waterfall, trace, main-thread profile | Limited — metric values and dimensions, not a trace |
| What it is good for | Catching regressions, comparing candidate fixes, setting budgets | Deciding whether the work succeeded, and finding which templates and segments are worst |
| Common misuse | Quoting a Lighthouse score of 98 on a throttled desktop run as proof the site is fast on mobile | Quoting CrUX green as proof that no page is slow, when the aggregate hides a slow template carrying most revenue |
| Our rule | Lab decides whether a change may ship; field decides whether the programme worked | Field baselines are captured in week one and reported at 90 days and 12 months |
We configure real-user monitoring segmented by template, device class, connection type and geography. On Indian estates the connection and device split is not a refinement, it is the whole story: a page that passes comfortably on a desktop in an office can fail badly on a mid-tier Android device on a congested mobile connection, and that is the majority of your traffic.
The diagnostic: where the milliseconds actually go
Week one produces a waterfall diagnosis per priority template. We do not guess and we do not apply a generic checklist; the diagnosis determines the sequence of work, and on most estates it reorders what the client expected to fix first.
| Layer | What we measure | Typical finding on an unaudited estate | Lever |
|---|---|---|---|
| DNS, TLS and connection | Lookup time, handshake time, protocol in use, connection reuse | Multiple origins and third-party domains each paying a fresh handshake; HTTP/1.1 still in use on the origin | Consolidate origins, enable HTTP/2 or HTTP/3, preconnect only where it earns its place |
| Server and application | Time to first byte, database query count and duration, object-cache hit rate, template render time | Uncached dynamic rendering of pages whose content changes monthly; fifty-plus queries per page | Page, fragment and object caching; query reduction; edge or full-page cache for anonymous traffic |
| Critical rendering path | Render-blocking resources, critical CSS coverage, font load strategy, first paint and first contentful paint | A global stylesheet loaded before anything paints; four font weights from an external provider; scripts in the head with no defer | Inline critical CSS, self-host subset fonts, defer and preload deliberately, remove render-blocking third parties |
| Payload and requests | Total weight by asset class, request count, compression ratio, cache headers, image formats and dimensions | Multi-megabyte hero images served at full resolution to a 360-pixel viewport; no modern formats; long-lived cache headers missing | Responsive images, modern formats, correct sizing, immutable caching, brotli compression |
| JavaScript and main thread | Bundle size, long tasks, hydration cost, unused code, third-party script time | A single vendor bundle shipped to every page; unused framework code; hydration blocking input for seconds on a mid-tier device | Code splitting, route-level bundles, tree shaking, deferred or partial hydration, facades for heavy embeds |
| Third-party estate | Every tag and embed with its cost in requests, bytes, milliseconds and main-thread time | Thirty-plus requests from a dozen domains for analytics, advertising, chat, social, video and consent, several of them redundant | Inventory, removal of duplicates, server-side or consent-gated loading, facades, contractual limits |
| Layout stability | Elements that shift, when they shift, and what triggers the shift | Images without dimensions, fonts swapping metrics, banners and consent dialogs injected above content, ad slots without reserved space | Explicit dimensions, font metrics matching, reserved space, injection rules |
The output is a prioritised plan where every item has a measured cost, an estimated gain in milliseconds and a named owner. Items whose gain is smaller than their risk are recorded as rejected, with the reason — which is how you avoid the optimisation that breaks a checkout.
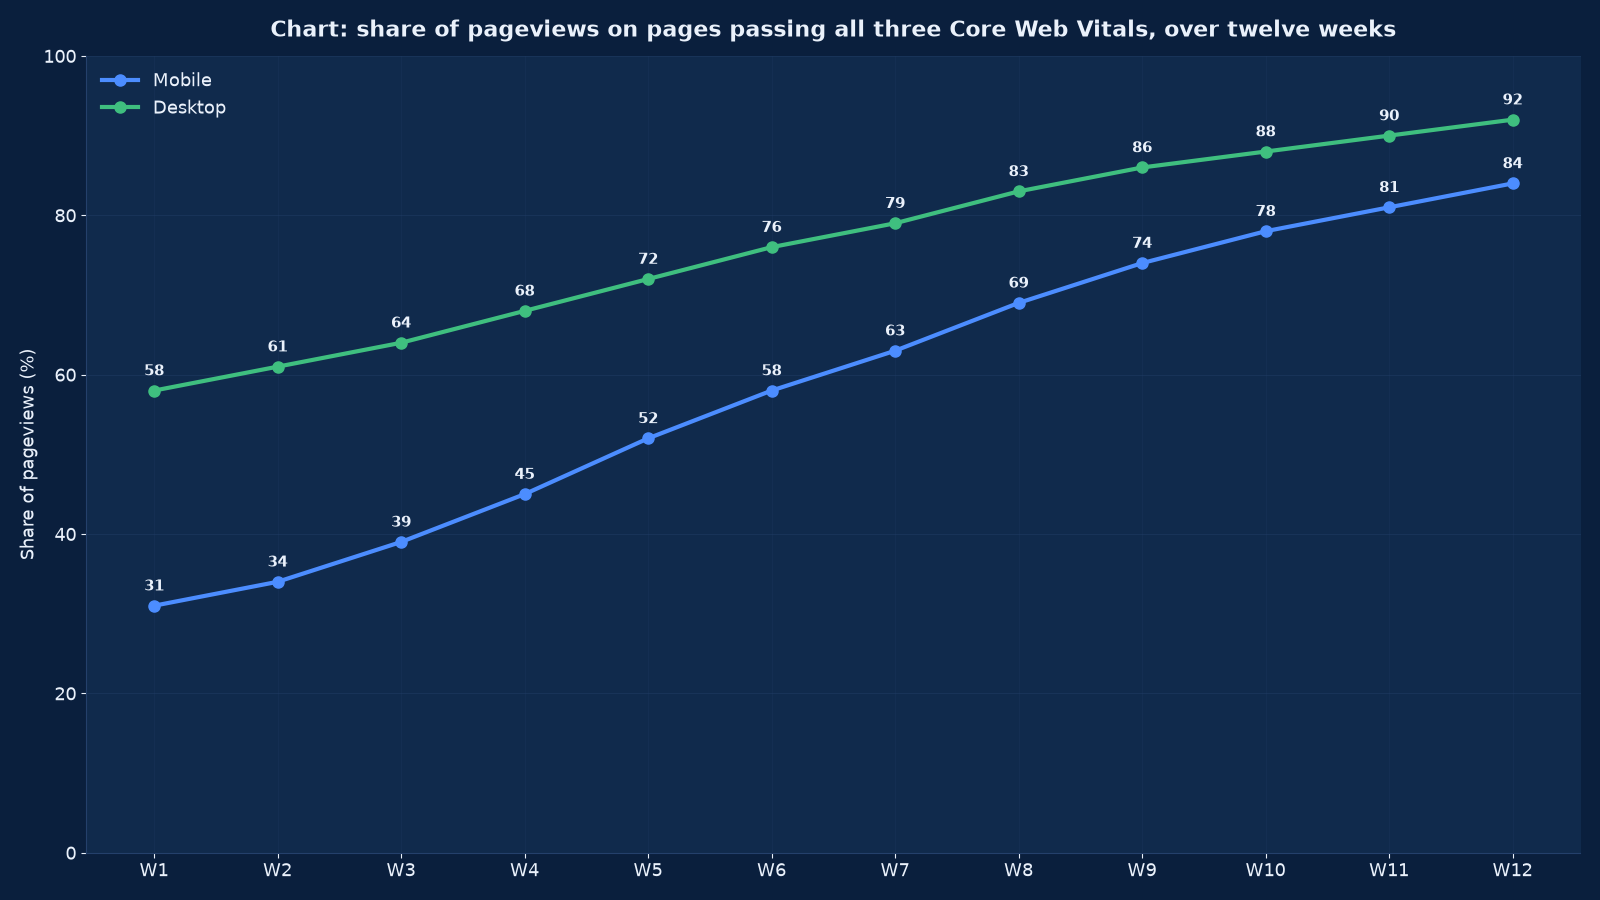
Chart values are an illustrative planning model based on typical UMC engagements and published industry benchmarks. They are not a guarantee of results on any specific project.
LCP engineering: the four causes and their fixes
Largest contentful paint failures reduce to four causes in almost every case. We identify the LCP element per template first, because the fix depends entirely on what that element is — a hero image, a headline, a video poster or a canvas all fail for different reasons.
| Cause | Diagnosis | Fix | Typical gain |
|---|---|---|---|
| Late server response | Time to first byte above 600 milliseconds; the LCP element cannot start until the HTML arrives | Full-page or edge cache for anonymous traffic, object caching, query reduction, and origin tuning; static generation for pages that do not need to be dynamic | 0.6 to 2.0 seconds |
| Late-discovered image | The hero image is set by CSS or loaded after JavaScript runs, so the browser finds it late in the preload scan | Move the image into HTML with fetchpriority high, preload the one hero asset per template, use responsive srcset and modern formats, and never lazy-load above the fold | 0.5 to 1.8 seconds |
| Render-blocking CSS or scripts | A global stylesheet or head script delays first paint; the LCP element waits behind resources it does not need | Inline critical CSS per template, load the rest asynchronously, defer non-essential scripts, and remove third parties from the head entirely | 0.4 to 1.5 seconds |
| Font loading | Text is invisible or re-rendered while a web font downloads from a third-party origin | Self-host subset fonts, use font-display swap with a fallback whose metrics match, preload the one or two faces actually used, and drop the weights nobody specified | 0.2 to 0.9 seconds, plus a CLS improvement |
The trap in LCP work is fixing the wrong element. A hero slider, for instance, will make the LCP element unpredictable and unfixable; the correct engineering answer is usually to remove the slider, which is also the answer most marketing teams resist and most users prefer. We present the measured cost of the slider and let the evidence make the argument. Landing-page optimisation and winning the page speed race cover the same ground from the conversion and the editorial side.
INP engineering: the main thread is the bottleneck
Interaction to next paint replaced first input delay in March 2024 and is the metric most estates fail, because it measures the whole page life rather than the first interaction. INP failures are almost always JavaScript: long tasks on the main thread mean the browser cannot respond to input promptly.
| Cause | How we find it | Fix | Risk to manage |
|---|---|---|---|
| Oversized vendor and framework bundles | Bundle analysis showing a single vendor chunk served to every route, with a high unused-code share | Route-level code splitting, dynamic import for heavy features, tree shaking, replacing a library with a smaller one where the surface area is tiny | Feature parity during the split; ship behind a flag and measure |
| Blocking hydration | A trace showing hydration occupying the main thread for seconds on a mid-tier device | Partial or progressive hydration, islands for interactive components, server-rendered static content that needs no JavaScript at all | Interactivity arriving late; hydrate above-the-fold components first |
| Long tasks from third-party scripts | Attribution showing tag managers, chat widgets, advertising and session-replay scripts owning the long tasks | Load after interaction or on idle, facade heavy embeds, move measurement server-side, remove redundant tags | Marketing losing data; agree the measurement contract before removing anything |
| Unoptimised event handlers | Profiling showing scroll, resize and input handlers doing layout reads and heavy computation | Throttle and debounce, batch DOM reads and writes, avoid layout thrashing, move computation to a worker | Perceived responsiveness changing; test with real users, not only with a trace |
| Heavy DOM and expensive selectors | DOM node counts in the thousands, deep trees, universal selectors and repeated forced reflows | Reduce nodes, virtualise long lists, scope selectors, and stop re-rendering whole trees for local state changes | Template changes required; sequence with the content model rather than against it |
On WordPress estates the equivalent work is plugin and script discipline: which plugins enqueue on every page, what jQuery-dependent code is still shipping, and whether the page builder is rendering a megabyte of inline CSS per page. Our WordPress engineering practice handles that layer, and React and Next.js builds handle the component layer, but the measurement method is identical.
CLS engineering: reserving space for everything that moves
Cumulative layout shift is the most underestimated of the three because it is invisible to anybody who built the page — the developer sees the finished state, not the sequence. It is also the cheapest to fix, and the one where a single rule prevents most future regressions.
| Shifting element | Why it moves | The rule |
|---|---|---|
| Images, video and iframes | No intrinsic dimensions, so the browser reserves nothing until the asset loads | Width and height attributes on every media element, or an aspect-ratio box; enforced in the CMS and in code review |
| Web fonts | Fallback text renders with different metrics, then reflows when the real font arrives | Size-adjusted fallbacks with matched metrics, font-display swap, self-hosted subsets, preload the faces actually used |
| Advertising and embed slots | Slots resize when the creative arrives, or when no creative is returned | Fixed minimum slot dimensions reserved in the layout, with collapse handled below the fold |
| Banners, consent dialogs and notifications | Injected above or into content after first paint | Reserve the space, or inject below the fold, or overlay without displacing content |
| Late-loaded components | Content rendered after an API call pushes everything down | Skeleton placeholders with the final dimensions, or server-side rendering of the initial state |
| Dynamic content from personalisation | A/B tests and personalisation swapping blocks after load | Decide before first paint wherever possible; where not, reserve the space and accept the measured cost in the experiment design |
One discipline worth adopting permanently: treat any element that appears after first paint as guilty until it has reserved its own space. It converts CLS from a metric you chase into a property your components have.
Third-party governance: the cost you did not commission
On most marketing-influenced estates, third-party scripts are the largest single controllable cost and the least governed. Nobody approved a page weight budget, but eleven vendors each added a tag, and the result is a page that loads 34 requests from a dozen origins before it becomes usable.
| Control | What it means in practice | Who must agree |
|---|---|---|
| Tag inventory with measured cost | Every script listed with its requests, bytes, main-thread milliseconds, blocking behaviour and the business question it answers | Marketing, analytics, engineering |
| Duplication removal | Two analytics suites, three pixel families and two heatmapping tools doing overlapping work are consolidated to one of each | Marketing and finance — usually a licence saving as well as a speed saving |
| Loading strategy per tag | Blocking, deferred, on-idle, on-interaction or server-side, decided per tag rather than inherited from a plugin default | Engineering with the tag owner |
| Facades for heavy embeds | Video, maps, social feeds and chat rendered as a lightweight placeholder until the user interacts | Marketing — with the click-through cost of the facade measured, not assumed |
| Consent-gated loading | Nothing that sets a cookie or fingerprints a device loads before consent; measurement that must run uses a consent-free, server-side route | Legal, marketing, engineering |
| Change control | No tag is added without an entry in the inventory and an accepted cost against the budget | Digital lead, with a named approver |
| Contractual terms | Agency and vendor contracts specify that scripts must be deferrable, must not block rendering and must be removable without breaking the page | Procurement and legal |
| Quarterly review | The inventory is re-measured; tags whose business question has been answered are removed | Marketing and engineering jointly |
The reduction from 34 third-party requests to 16 in Figure 1 was not achieved by optimising scripts. It was achieved by removing eleven of them, which is a governance decision rather than an engineering one — and it is the highest-return hour in the whole programme.
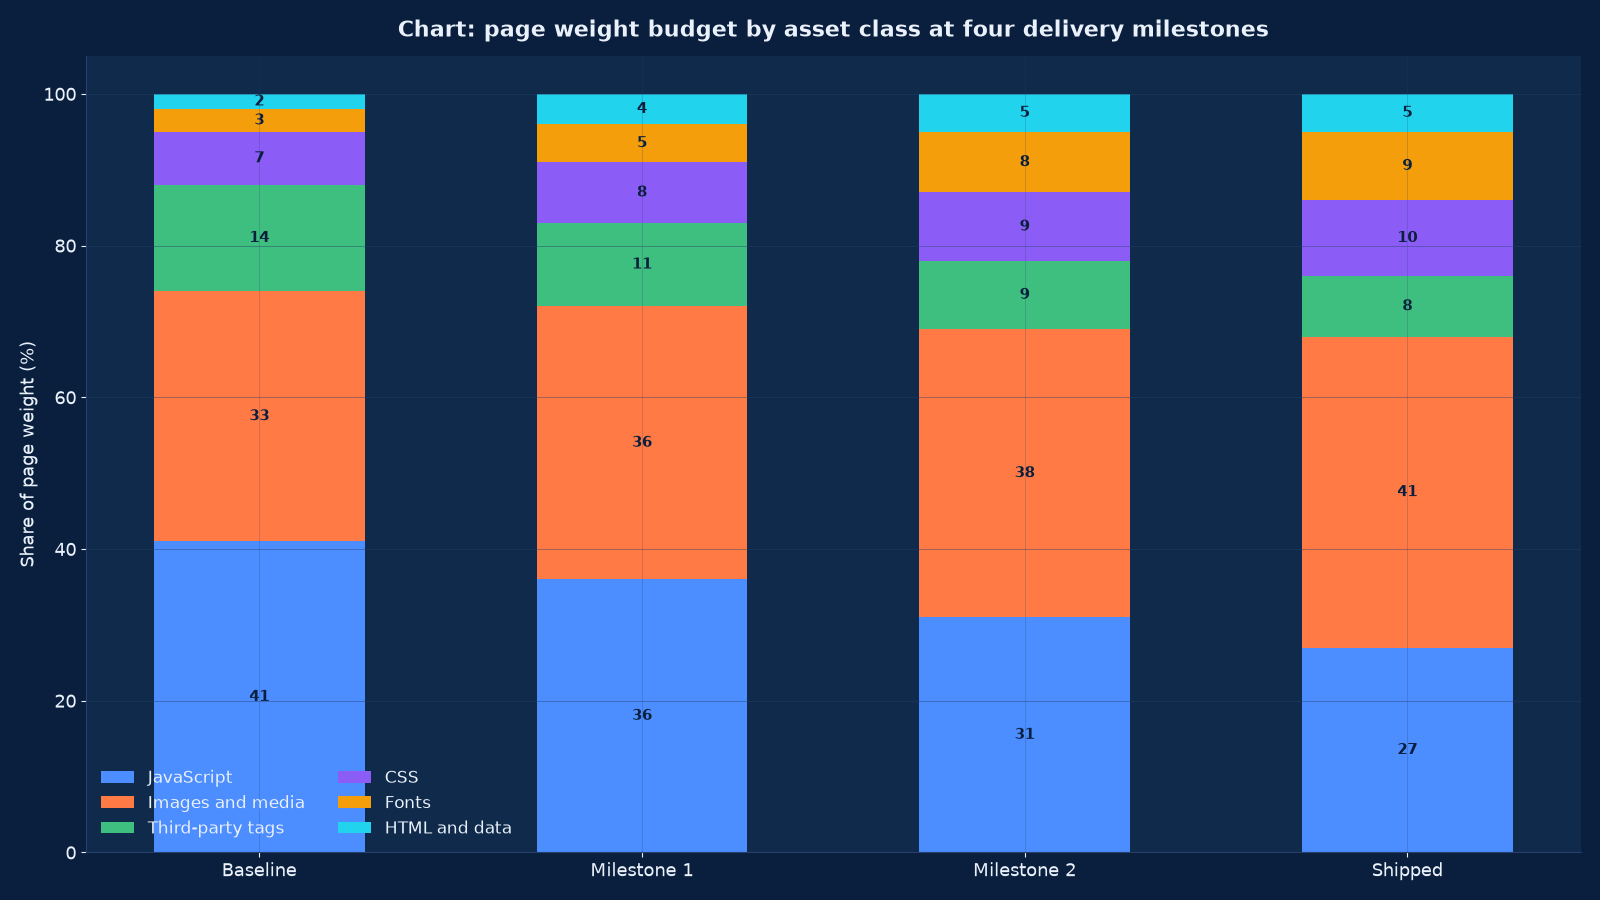
Chart values are an illustrative planning model based on typical UMC engagements and published industry benchmarks. They are not a guarantee of results on any specific project.
Server, cache and delivery: the ceiling under everything
Front-end optimisation cannot rescue a slow origin. Where time to first byte exceeds roughly 600 milliseconds, the correct first move is the delivery layer, and it is usually cheaper and faster than any JavaScript work.
| Lever | What it does | When it is the right first move | Caution |
|---|---|---|---|
| Full-page caching for anonymous traffic | Serves rendered HTML from cache instead of rebuilding it per request | Content pages, service pages, blog and category archives — the majority of most estates | Personalisation, cart state and logged-in sessions must be excluded or fragment-cached |
| Object and query caching | Removes repeated database work from dynamic rendering | Dynamic applications, portals and commerce with heavy read patterns | Invalidation rules must be explicit, or you serve stale prices and stock |
| Edge delivery and CDN | Serves assets and cached HTML from a location near the visitor, terminating TLS at the edge | Any estate with visitors spread across regions or countries | Cache headers and purge behaviour must be designed, not defaulted |
| Static generation and incremental regeneration | Builds pages at deploy or on content change rather than at request time | Marketing and editorial estates with predictable templates | Build times and content-change latency need a budget of their own |
| Compression and protocol | Brotli or gzip, HTTP/2 multiplexing or HTTP/3, connection reuse, early hints where supported | Always — these are configuration, not projects | Verify origin and CDN agree; mismatched settings silently disable the benefit |
| Database and index tuning | Slow-query elimination, index coverage, connection pooling, and removing queries that fetch unused columns | Applications where render time is dominated by data access | Measure before changing; an index can help one query and hurt writes |
| Hosting and runtime right-sizing | Correct PHP or Node version, tuned PHP-FPM or worker pool, adequate memory, and an environment that matches the traffic profile | Where the origin is saturated at peak rather than slow at baseline | Cost must be justified with field data, not with a peak-day anecdote |
Hosting decisions belong with the evidence in hand. We work alongside cloud migration and architecture, DevOps and CI/CD engineering, cloud cost optimisation and server, storage and data-centre engineering where the delivery layer is the constraint, and we will tell you when the answer is a caching rule rather than a bigger server.
The twelve-week programme
A typical engagement runs twelve weeks: two weeks of instrumentation and diagnosis, eight weeks of engineering in four sprints, two weeks of verification, budgets and handover. Field results lag deployment, so the reporting cadence is designed around the lag rather than pretending it is not there.
| Week | Workstream | Output | Decision point |
|---|---|---|---|
| 1 to 2 | Instrumentation and diagnosis | Real-user monitoring live; baseline at the 75th percentile per template and device; waterfall diagnosis; third-party inventory with cost per tag | Agree the baseline and the prioritised plan |
| 2 to 3 | Delivery layer | Caching strategy, edge configuration, compression and protocol, origin tuning; time to first byte measured before and after | Confirm the caching and invalidation rules with the business |
| 3 to 5 | Critical rendering path and media | Critical CSS, font strategy, preload and priority hints, responsive images and modern formats, media pipeline | Review LCP per template against the new baseline |
| 5 to 7 | JavaScript and main thread | Code splitting, hydration strategy, long-task elimination, worker offload where useful | Review INP per template; accept the bundle-size budget |
| 6 to 8 | Third-party remediation | Tags removed, consolidated, deferred or facaded; consent gating; contractual terms drafted | Marketing sign-off on what was removed and what was kept |
| 8 to 10 | Layout stability and template pass | Reserved dimensions, skeletons, injection rules; CLS closed per template | Confirm the component rules enter the design system |
| 10 to 11 | Verification | Lab suite on every priority template across device and network profiles; field data at 90 per cent of the window; accessibility and function regression check | Accept or re-open items against the measured result |
| 11 to 12 | Budgets, gate and handover | Performance budgets per template, pipeline gate configured, dashboards and alerts, runbook, training | Assign budget ownership; schedule the monthly review |
Two rules keep the programme honest. First, no change ships without a lab measurement attached to it, so every claim is reproducible. Second, no performance fix may degrade accessibility, conversion instrumentation or editorial capability — we verify all three, because a faster page that a screen reader cannot use or an editor cannot publish is not an improvement.
Performance budgets: how the gain is kept
A budget is a number, an owner and a consequence. Without all three, performance regresses within two quarters of the engagement ending, because the pressure to add a feature is continuous and the pressure to stay fast is not.
| Budget | Typical value per template | Measured by | Consequence when exceeded |
|---|---|---|---|
| Total page weight | Under 1.5 MB mobile, 2.5 MB desktop for content templates | Lab waterfall on every release | The release is blocked until the addition is justified or the budget is formally raised |
| Request count | Under 40 requests, of which under 12 are third-party | Lab waterfall and the tag inventory | A new tag requires an entry in the inventory and a removal candidate |
| JavaScript | Under 350 KB transferred per template, no vendor bundle above 200 KB | Bundle analysis in the pipeline | Code splitting or deferral required before merge |
| Largest contentful paint | Under 2.5 seconds at the 75th percentile, mobile and desktop | Field monitoring with lab confirmation per release | The template is flagged; a fix is scheduled in the next sprint |
| Interaction to next paint | Under 200 milliseconds at the 75th percentile | Field monitoring plus long-task counts in the lab | Any new long task above 50 milliseconds is investigated before merge |
| Cumulative layout shift | Under 0.1 at the 75th percentile | Field monitoring; lab shift attribution | The shifting element must reserve its space; no exception without a review date |
| Time to first byte | Under 600 milliseconds, under 200 for cached anonymous pages | Field monitoring and origin logs | Cache coverage or query cost is reviewed before any front-end work is commissioned |
| Main-thread work | Under 300 milliseconds of long tasks on a mid-tier device profile | Lab trace on a defined throttled profile | Hydration or script loading strategy is revisited |
Budgets are set per template class, because a product listing with facets and a long-form article have different honest costs. We publish the profile we throttle to — a defined mid-tier Android device on a defined connection — so the numbers mean the same thing to your team as they do to ours.
The commercial case, measured rather than asserted
Performance work is funded on the strength of its commercial case, and the case is stronger when it is measured on your estate than when it is quoted from an industry study. We capture the baseline in week one so the improvement can be attributed.
| Lever | How speed affects it | How we measure it | Typical observation |
|---|---|---|---|
| Conversion rate | Every additional second of delay reduces the share of visitors who complete a journey; the effect is steepest on mobile and on mid-tier devices | Conversion per template before and after, controlling for seasonality and traffic mix | Journey-level lifts appear first on the pages where LCP and INP were worst |
| Bounce and abandonment | Visitors leave before the page becomes usable; on slow estates the bounce is a rendering failure, not a content judgement | Bounce and abandonment per template, plus real-user sessions segmented by field metric value | The gap between the fastest and slowest quartile of sessions is usually larger than the gap between channels |
| Organic visibility | Page experience is one input among many, and a slow estate also tends to have crawl and rendering problems that suppress indexing | Search Console coverage, crawl stats and clicks per template, alongside field metrics; see our SEO practice for the full programme | Improvements show up as crawl efficiency and rendered-page quality before they show up as ranking movement |
| Paid-media efficiency | Landing-page experience feeds ad quality and cost per click; a slow page raises the price of the same position | Quality score, cost per click and cost per acquisition per landing page before and after | The clearest and fastest return in the whole business case, which is why we sequence paid landing pages early |
| Support and operational cost | Slow and unstable pages generate contacts: “why will not this load” is a ticket | Contact volume tagged to performance issues, plus error rates in monitoring | Falls alongside CLS and INP fixes more than alongside raw load time |
| Infrastructure cost | Caching and payload reduction lower compute, bandwidth and egress, sometimes enough to fund the engagement | Monthly infrastructure cost per thousand requests before and after | Cache hit-rate improvements are usually the largest single line |
We report the commercial case against the baseline with the instrument named, and we publish the metrics that did not move. Where a client wants a forecast before committing, we model it from the field distribution — how many pageviews sit in the slow tail, and what those sessions currently convert at — rather than applying a generic percentage from a study of somebody else’s traffic.
Framework-specific playbooks
The measurement method is universal; the fixes are not. Each stack has a characteristic failure profile, and knowing it in advance shortens the diagnosis from days to hours.
| Stack | Characteristic failure profile | The playbook |
|---|---|---|
| WordPress and WooCommerce | Uncached dynamic rendering, plugin scripts enqueued globally, page-builder inline CSS, unoptimised uploads, object-cache absence, admin-ajax calls on the front end | Full-page cache with fragment caching for cart and account, plugin audit with per-page enqueue control, critical CSS per template, a media pipeline with modern formats and dimensions, object cache and query reduction, and removal of builder-generated bloat. Our large-project WooCommerce practice runs the commerce side |
| React, Next.js and JavaScript storefronts | Large vendor bundles, blocking hydration, client-side data fetching for content that could be server-rendered, images not using the framework’s optimiser, third-party SDKs loaded eagerly | Route-level splitting, static or incremental generation for content routes, partial hydration or islands for interactivity, framework image optimisation with priority hints, and deferring SDKs until interaction |
| Laravel and PHP applications | Slow queries and N-plus-one access, missing opcache or misconfigured PHP-FPM, session and cache drivers on the same slow store, synchronous work that belongs in a queue | Query profiling and index coverage, opcache and FPM tuning, Redis for cache and sessions, queue workers for anything not on the request path, response caching for read-heavy routes. Our enterprise Java and .NET practices apply the same logic to their runtimes |
| Headless and composable commerce | Chatty API calls at request time, no caching layer between the front end and the commerce engine, preview and personalisation defeating the cache, image delivery not optimised at the edge | Edge and API response caching with explicit invalidation on content change, request consolidation and batching, cache-key design that survives personalisation, and edge image transformation. Our commerce engineering team builds the integration layer |
| Portals and authenticated applications | Per-user pages that cannot be cached, heavy grids and dashboards rendering thousands of DOM nodes, session-bound assets, long tasks from data visualisation | Fragment caching of shared components, virtualised grids, worker offload for computation, progressive loading of panels, and payload reduction on data-dense views. Systems integration covers the source-system side |
Where an estate is mixed — a WordPress marketing site, a React storefront and a Laravel portal behind one domain — we run one measurement layer across all three and separate budgets per stack, because a single global budget would be met by the easy estate and missed by the hard one.
Indian network and device reality
Performance targets set from a metropolitan office connection describe a minority of Indian traffic. The engineering decisions that matter here are the ones that survive a mid-tier device on a congested mobile network, and they are not the same decisions that a Western case study would recommend.
| Condition | Why it matters | What we change |
|---|---|---|
| Predominantly mobile, often mid-tier | Main-thread work and JavaScript weight hit these devices hardest; INP degrades long before load time looks bad on a laptop | Throttle to a defined mid-tier profile for every lab test; split bundles aggressively; defer hydration |
| Congested and variable mobile networks | Latency and packet loss multiply the cost of every additional request and every extra origin | Fewer requests, fewer origins, connection reuse, compression, and edge delivery closest to the audience |
| Data cost sensitivity | Visitors on limited plans abandon heavy pages; payload is a commercial constraint, not only a technical one | Page-weight budgets per template, modern image formats, no autoplaying video, facades for heavy embeds |
| Regional and language variety | Fonts for Devanagari, Tamil, Telugu and Bengali scripts are large, and fallback metrics differ from Latin | Subset fonts per script actually used, size-adjusted fallbacks, preload only the faces in play, and measure CLS on the affected templates specifically |
| Power and thermal constraints | Sustained JavaScript work drains battery and throttles the device, which shows up as later interactions getting slower | Long-task budgets, worker offload, removing session-replay and heatmapping scripts that run continuously |
| Peak-load concentration | Traffic arrives in sharp peaks around results, festivals, sales and campaigns, when the estate is slowest | Cache coverage designed for peaks, load testing at a realistic multiple of peak, and an on-call arrangement through our support practice during known events |
This is also why we report field data segmented by connection type and device class. An aggregate green in Search Console can conceal a failing majority on mobile in a particular region, and the segmented view is what makes the case for the next sprint. our website speed optimisation guide and how to load in under three seconds describe the practical sequence for smaller estates.
Engagement models and fees
Four models cover the situations we meet. All begin with a paid diagnostic, because a performance programme without a measured baseline produces claims nobody can verify.
| Model | Duration | Included | Best for |
|---|---|---|---|
| Performance diagnostic | Two to three weeks | Field instrumentation, baseline at the 75th percentile per template and device, full waterfall diagnosis, third-party inventory with cost per tag, prioritised plan with estimated gains and a modelled commercial case | Deciding what to fix first, or establishing whether speed is actually the problem |
| Full engineering programme | Twelve weeks | Delivery layer, critical rendering path, media pipeline, JavaScript and main-thread work, third-party remediation, layout stability, verification, budgets, pipeline gate, dashboards and training | A rebuild that shipped slow, a tender requirement, or a conversion problem traced to speed |
| Focused sprint | Two to four weeks | One template class or one metric — usually paid landing pages before a campaign, or a blocking LCP failure on a revenue journey | A deadline: a campaign launch, a tender submission, a seasonal peak |
| Performance retainer | Twelve months | Budget ownership, pipeline gate maintenance, monthly field review, quarterly lab suite, third-party change control and on-call cover for known peaks | Estates that ship continuously and have already learned that speed decays without an owner |
Fees are fixed for the diagnostic and quoted per programme after scoping, based on template count, stack complexity and the size of the third-party estate. We will tell you when the answer is a caching configuration rather than an engagement: on a meaningful share of estates we diagnose, the delivery layer alone recovers most of the gap and the remaining work is a two-week sprint.
Misconceptions we spend time correcting
Each of these has cost a client money, and each is corrected by measurement rather than argument.
| Misconception | Correction |
|---|---|
| “Our Lighthouse score is 98, so we are fast.” | A lab score on a throttled desktop profile measures one run of one page. Field data at the 75th percentile on mobile is what visitors experience and what search uses. We have audited estates with a 98 lab score and a 4.8-second mobile LCP. |
| “We added a caching plugin, so performance is handled.” | A caching plugin without a cache-key design, invalidation rules and exclusion logic serves stale or wrong content, and does nothing for third-party cost or main-thread work. |
| “Compressing images is the main win.” | It is usually the second or third win. On most estates the first is time to first byte and the second is JavaScript weight; images matter most where the hero is oversized for the viewport. |
| “Lazy loading everything makes it faster.” | Lazy-loading the LCP element makes it slower, sometimes dramatically. Loading must be prioritised above the fold and deferred below it — not uniformly deferred. |
| “Core Web Vitals is a ranking factor, so it is a marketing problem.” | It is one input among many, and the more immediate commercial effects are conversion, abandonment and paid-media cost. Treating it as a ranking checkbox produces fixes that help the score and not the visitor. |
| “A faster site needs a new platform.” | Rarely. The delivery layer, the rendering path and the third-party estate account for most of the gain on the existing platform. Replatforming for speed alone is usually the most expensive way to buy the least of it — which is a judgement we make with the replatforming evidence, not against it. |
| “Performance and accessibility trade off against each other.” | They mostly reinforce each other: semantic HTML is lighter than script-driven equivalents, captions and transcripts are text, and fewer third-party embeds improve both. The genuine conflicts are few and solvable with reserved space and correct font strategy. |
The pattern underneath all of them is the same: a proxy measure is mistaken for the thing itself. A score, a plugin, a technique or a platform is not performance. The 75th percentile of your visitors’ experience is performance, and it is measurable this afternoon.
Frequently Asked Questions About Core Web Vitals and Performance Engineering
What do you need access to in order to start?
Analytics and Search Console access, the ability to add a real-user monitoring snippet, repository or CMS access, a staging environment that mirrors production configuration, and CDN, DNS and hosting control or a named contact who has it. Without hosting control we can still diagnose and specify, but the delivery-layer work has to be executed by whoever holds it.
How quickly do results appear?
Lab results are immediate per change, and our own field data moves within days. Search Console Core Web Vitals reporting uses a rolling 28-day window, so expect roughly four to six weeks for a deployed fix to be fully reflected there. We report against our own instrumentation in the meantime rather than waiting.
Can you guarantee we pass Core Web Vitals?
We commit to measured improvements against the baseline and to a documented engineering effort per failing template, not to a search-report colour, because field data depends on your traffic mix, device population and third-party estate — none of which we control unilaterally. Where a third-party script is the binding constraint, we say so in writing and put the obligation where it belongs.
Will the fixes break our analytics, pixels or personalisation?
They can if done carelessly, which is why we inventory every tag with its business question before changing any of them, agree the removal and deferral decisions with marketing, and verify data continuity after each change. Measurement integrity is an acceptance criterion, not a hope. Our analytics and attribution practice runs the verification where the tagging is complex.
Do you work on sites your team did not build?
Yes, and that is most of the work. We need code or CMS access and a deployable staging environment. Where the original vendor is uncooperative or has disappeared, we can take on the estate through our engineering augmentation team and remediate it directly.
Is a rebuild sometimes the right answer?
Occasionally, yes — usually where the platform cannot cache, the template layer cannot be changed without a vendor, or the JavaScript architecture makes splitting impossible. We make that recommendation only after measuring, and we cost the alternative of remediating in place so the decision is a comparison rather than a preference. the case for consolidating a tech stack covers the same reasoning at portfolio level.
How do you handle page builders and visual editors?
By measuring what they cost and then constraining them: critical CSS extraction for builder output, disabling unused widget assets, controlling enqueue scope per page, and defining which templates may be edited visually and which must be code. Where a builder is the dominant cost and cannot be constrained, we say so plainly.
What about video, maps and heavy media?
Video is loaded through a facade with a lightweight poster and explicit dimensions, so it costs nothing until the visitor chooses it. Maps are facaded the same way. Heavy media that is genuinely the product — a portfolio, a catalogue — gets a delivery pipeline with modern formats, responsive sizing and progressive rendering rather than being removed.
Do you optimise for search or for users?
For users, measured in the field, and search follows. The techniques that improve the 75th percentile of real sessions are the same ones that improve crawl efficiency and rendered-page quality. Optimising for a lab score alone produces changes that help neither.
What does it cost, and is the diagnostic credited?
The two to three week diagnostic is a fixed fee after scoping and is credited in full against a full programme if you proceed within ninety days. The full twelve-week programme is quoted on template count, stack complexity and third-party estate size. Focused sprints are quoted per template class.
How do we stop it regressing?
With the gate: performance budgets per template, automated lab tests on every release with a blocking threshold, field dashboards with alert thresholds, third-party change control with a named approver, and a monthly performance review that reports the numbers that moved. The budgets have owners, and the consequence of exceeding one is defined before the engagement ends rather than after the first regression.
Commission a Core Web Vitals and Performance Diagnostic
Send us the URL, the templates that matter commercially, and any deadline you are working to — a campaign, a tender, a seasonal peak. Within ten working days you will have field baselines at the 75th percentile per template and device class, a full waterfall diagnosis showing where the milliseconds actually go, a third-party inventory with a measured cost per tag, a prioritised plan with estimated gains, and a modelled commercial case built on your own traffic distribution.
Contact Unified Management Consulting to arrange a confidential first conversation.
Related Services
Performance engineering is delivered with the practices that own the layers we change:
- Website Development Services — the build route where performance is specified in rather than retrofitted
- Full-Stack WordPress Development — caching, plugin discipline and template engineering on WordPress estates
- Full-Stack React Development — bundle splitting, hydration strategy and static generation for component front ends
- Cloud Services & Migration — the delivery and hosting architecture underneath time to first byte
- DevOps & CI/CD Engineering — the pipeline where the budgets and the gate live
- Conversion Rate Optimization Services — journey-level measurement that turns speed gains into commercial evidence
- Search Engine Optimization Services — crawl efficiency and rendered-page quality in the wider search programme
- UX & UI Design Services — designing within the budget instead of against it
- Website Strategy & Information Architecture — task analysis, full content inventory, card sorts and tree tests, content model, navigation and governance
- Accessibility (WCAG) Remediation & Compliance — WCAG 2.2 Level AA audits, severity-ranked defect registers, design-system remediation, assistive-technology verification and accessibility statements
- Web Application Maintenance & Support — patching, monitoring, verified backups, defect management, committed change capacity and monthly service reporting
- PHP & Laravel Development — legacy assessment, domain modelling, strangler-fig modernisation, APIs, test automation and CI/CD on modern PHP
- Headless & Composable Commerce — readiness assessment, capability mapping, storefront engineering, integration layer, migration rehearsals and cost governance
- Website Migration & Replatforming — full estate inventory, one-to-one redirect maps, functional parity, dry-run rehearsals, staged cutover and tested rollback
- Portal Development & Self-Service Platforms — entitlement modelling, single sign-on, source-system integration, self-service journeys and adoption instrumentation