
Chart values are an illustrative planning model based on typical UMC engagements and published industry benchmarks. They are not a guarantee of results on any specific project.
A ten per cent cut applied across the board is not a decision. It is an admission that nobody knows which costs create value — and the business discovers which ones did about two quarters later.
Cost rationalisation and margin recovery is the work of taking cost out deliberately and putting margin back in at the same time: decomposing the cost base to see which lines are addressable, analysing contribution by product, customer and channel to find the revenue that is not worth having, and executing a savings plan with named owners, guardrails and a run-rate that survives. Unified Management Consulting runs this as an eight-week programme, measured in cash and margin evidenced in the accounts rather than in projected percentages.
📉 Cost Rationalisation & Margin Recovery — Quick Summary
| Component | What We Deliver |
|---|---|
| Cost-base decomposition | Every cost line classified as addressable, contractual or structural, with a value and an owner against each opportunity. |
| Zero-based review | Each cost justified against what it delivers today rather than against last year’s budget, starting from zero. |
| Margin analysis | Contribution by product, customer, contract and channel including the real cost to serve — which usually finds negative-contribution revenue. |
| Pricing discipline | The gap between list, approved and invoiced, discount authority, indexation and the reprice list. |
| Procurement and suppliers | Spend by supplier and category, contract coverage, price against market, consolidation and renegotiation. |
| Property and facilities | Space used against space paid for, lease break dates, site utilisation and consolidation options. |
| Process and technology cost | Cost to serve per transaction, licences against active users, overlapping tools, renewal commitments. |
| Structure and people | Spans of control, duplicated layers, overtime covering structural gaps, contractor spend, and automation alternatives. |
| Savings tracking | Run-rate savings evidenced in the accounts, separated from one-off gains, with a monthly report until the run-rate holds. |
This service is the margin counterpart to cash flow and working capital recovery, follows naturally from the 30-Day Turnaround Diagnostic, and shares its cost classification discipline with Cloud Cost Optimisation & FinOps on the technology side. Margin measurement depends on the information discipline in Data Science Services for Business Analytics.
Why Cost Programmes Fail
The failure is almost never a lack of savings identified. It is the method of selection: cutting proportionately to spend rather than to value.
| Approach | What it does | Why it usually fails |
|---|---|---|
| Across-the-board percentage cut | Reduces everything by the same proportion, quickly | It removes capacity from the functions that were already lean and protects the ones that were already wasteful, because the cut is proportionate to spend rather than to value |
| Headcount-first reduction | Delivers the largest visible number fastest | People cost is the slowest to reverse and the most damaging to the recovery; the delivery capability usually goes before the overhead does |
| Freeze everything | Stops spend while the position is understood | Freezes the investment needed to fix the margin problem, and good people leave during freezes |
| Outsource to reduce cost | Converts internal cost into a contracted price | Works where volume is variable; fails where it transfers a process nobody has measured, because the inefficiency is priced into the contract |
| Renegotiate every supplier | Produces small savings across many contracts | Consumes months for a low total, and damages the relationships that matter in a downturn |
| Zero-based review by category | Justifies each cost against current value, in priority order | It does not fail — but it takes six to eight weeks and requires someone to make the unpopular decisions |
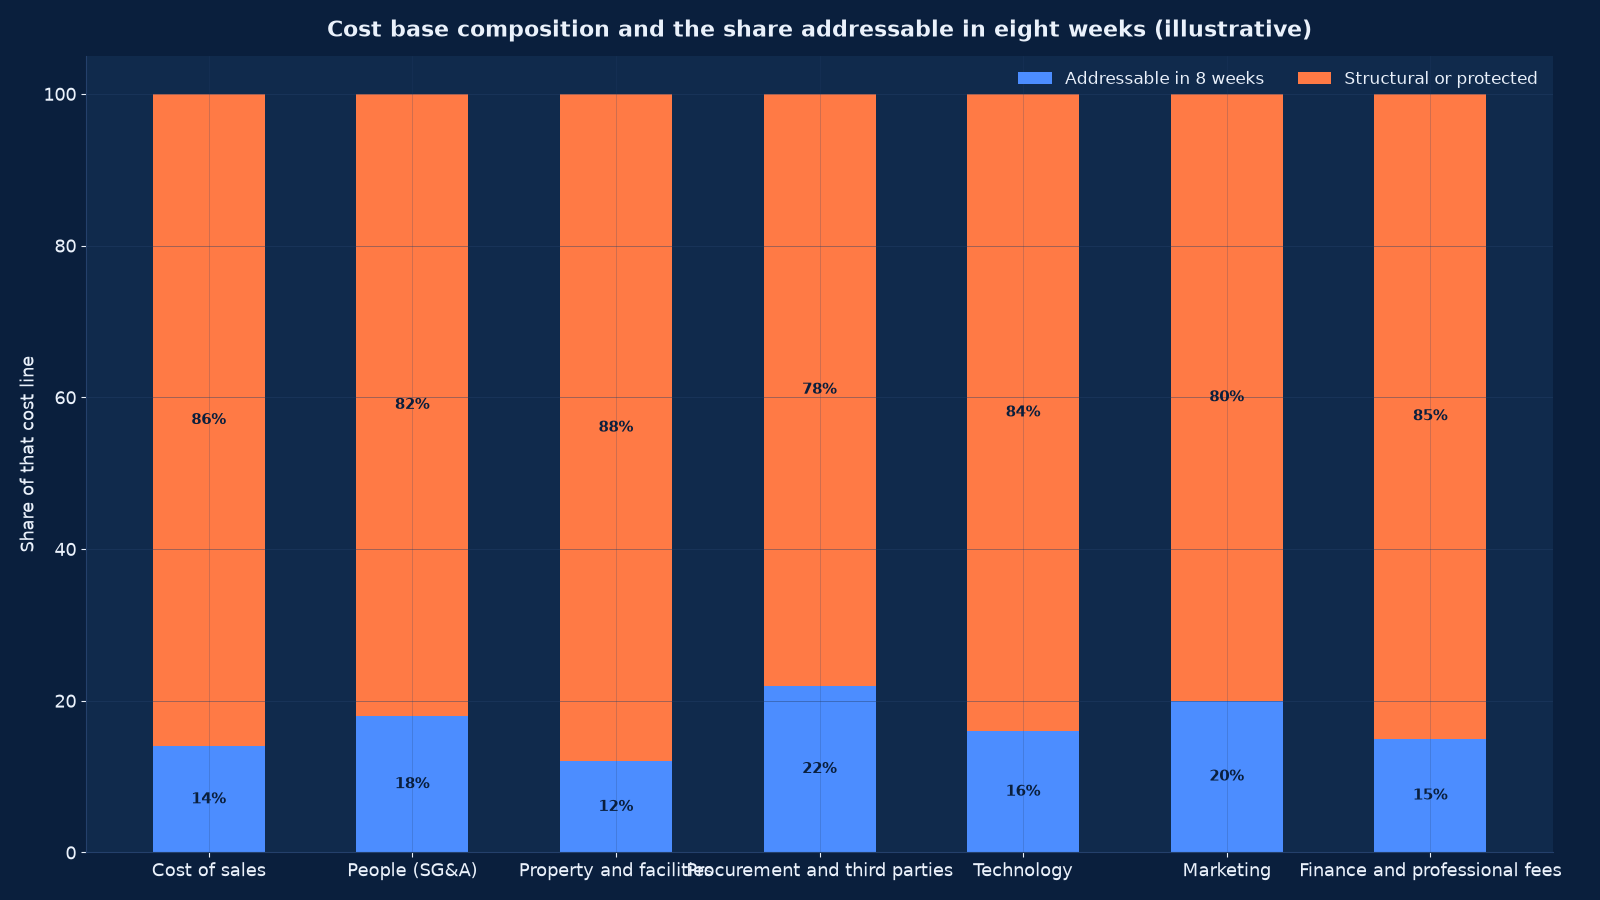
The last row is the approach we use. Zero-based does not mean rebuilding the budget from a blank sheet every year — it means each cost line has to answer what it delivers today, with the answer evidenced rather than asserted. Applied to the addressable share in Figure 1, it takes six to eight weeks and produces savings that survive the year.
The Cost-Base Decomposition
Every line is classified addressable (changeable within eight weeks), contractual (committed, with a known end or break date) or structural (requiring a change in the business model). The classification is what stops the plan promising savings that cannot be delivered.
| Cost line | What we test | Typical addressable finding |
|---|---|---|
| Cost of sales | Input prices against market and against contract, yield and waste, rework rate, freight and logistics, subcontract dependency | Input price drift never passed through; rework treated as normal rather than measured |
| People (SG&A) | Headcount against activity, spans of control, overtime share, vacant roles carrying work, contractor and agency spend, grade mix | Overtime covering a structural gap; two layers doing the same coordination |
| Property and facilities | Space used against space paid for, utilisation by site and shift, lease terms and break dates, energy and rates | Under-used space with a break opportunity inside twelve months |
| Procurement and third parties | Spend by supplier and category, contract coverage, price against market, duplicate suppliers, maverick spend | Five to fifteen per cent on addressable spend, concentrated in three or four categories |
| Technology | Licences against active users, overlapping tools doing the same job, renewal dates and commitment terms, support tiers | Unused licences and duplicated tooling; commitments renewing unexamined |
| Marketing | Spend by channel against attributable outcomes, agency fees against deliverables, campaign frequency | Channels funded by habit rather than by measured return |
| Finance and professional | Recurring advisory, audit, legal, banking and insurance spend | Retained services no longer used; insurance and banking priced from loyalty rather than market |
| Travel and entertainment | Policy compliance, purpose, and whether the spend produces outcomes | Small in total, but a visible signal of discipline |
Figure 1 shows the addressable share by line. Note the ordering: the lines where cutting is easiest and least damaging — procurement, marketing, technology, professional fees — carry the highest addressable share, while cost of sales carries the lowest. Programmes that start with cost of sales and headcount do the reverse of this, which is why they save less and break more.
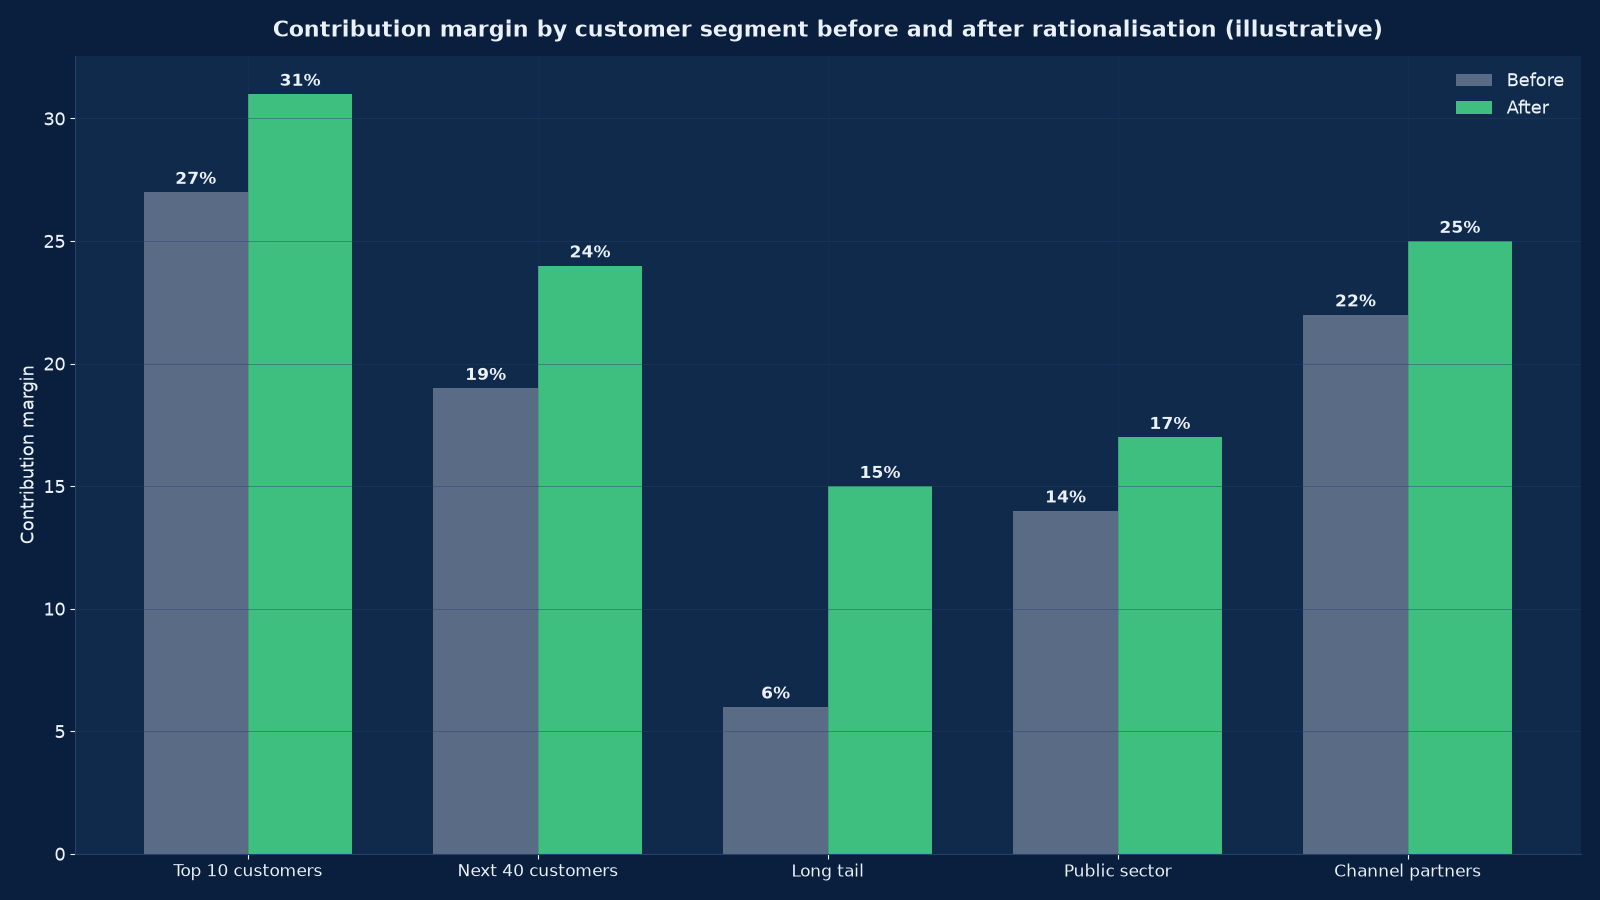
Chart values are an illustrative planning model based on typical UMC engagements and published industry benchmarks. They are not a guarantee of results on any specific project.
Margin Recovery: The Other Half
Cost reduction and margin recovery are usually presented as one programme and executed as two. Both are needed, because in most businesses the larger opportunity is on the revenue side.
| Analysis | What it reveals | Action it produces |
|---|---|---|
| Contribution by customer | Which customers consume more cost than they return once delivery, support, payment behaviour and account management are included | A reprice-or-exit list, and a service model change for the ones worth keeping |
| Contribution by product or service | Which lines carry the business and which are subsidised by them | Rationalisation of the tail, repricing, or a cost-to-serve fix |
| Contribution by channel | The real cost of each route to market, including partner margin and tender cost | Channel mix change, which is often larger than any cost cut |
| Discount and price leakage | The gap between list, approved and invoiced price, and who approved the exceptions | Discount authority thresholds and withdrawal of uneconomic terms |
| Contract profitability | Fixed-price work where scope grew without price, and indexation never applied | Renegotiation, change-control discipline, indexation in new contracts |
| Volume and mix effect | Whether margin fell because of price, cost, or mix | The correct target: fixing mix is different from fixing price |
The single most valuable output is the negative-contribution list. In our experience a material share of revenue in most mid-market businesses contributes nothing or less than nothing once the real cost to serve is included, and almost nobody knows it because contribution is measured at gross margin rather than after delivery and support cost. Removing or repricing that revenue improves margin immediately and often releases capacity as well. Market Research & Competitive Analysis is how we test whether the repricing will hold in your market rather than assuming it will.
Cost to Serve: Where Margin Is Actually Lost
Gross margin tells you what a sale earns before the cost of having that customer. Cost to serve tells you what it earns after. The difference between the two is where most mid-market margin disappears.
| Cost-to-serve driver | How it is measured | Lever |
|---|---|---|
| Order pattern | Orders per customer per month, average order value, order-to-invoice touches | Minimum order values, ordering windows, self-service ordering |
| Delivery exceptions | Rework, re-delivery, expedited freight, special handling per customer | Root-cause fix upstream, or a charge for the exception |
| Support and queries | Contact volume per customer, handling time, escalation rate | Product or process fix, tiered support, or a service charge |
| Payment behaviour | Days beyond terms, dispute rate, collection effort | Terms enforcement, deposits, or exit — a slow payer consumes cash that has a price |
| Customisation | Non-standard configuration, bespoke reporting, dedicated resource | Standardise, price the customisation, or decline it |
| Account management | Coverage cost against contribution | Right-size coverage to the contribution the account earns |
| Compliance and documentation | Certification, testing, audit and paperwork per contract | Recover it in price, or consolidate it across contracts |
Measure it per customer for the top twenty and per segment for the rest. Three findings appear almost every time: a large customer whose exceptions and payment behaviour erase their discount advantage; a long tail of small orders whose handling cost exceeds their contribution; and customisation provided free because nobody priced it. Each has a different fix, and none of them is a cost cut.
Procurement and Supplier Consolidation
Procurement carries the largest addressable share in Figure 1, and the work is more mechanical than it is adversarial.
- Know the spend. Total spend by supplier and by category, including the maverick spend that bypasses procurement entirely. Most businesses cannot produce this in week one, which is the first finding.
- Cover the spend. Contracts where terms, price basis and exit are documented. Uncontracted spend has no leverage and no protection.
- Consolidate within categories. Five suppliers in one category become two, with better terms because the volume is worth negotiating for and because administration falls.
- Test price against market. For the largest ten categories, a benchmark rather than an assumption. Loyalty pricing is common and rarely favourable.
- Look at total cost, not unit price. Order frequency, minimum quantities, lead time, quality failures and payment terms all belong in the comparison.
- Protect supply. A saving that creates a single point of failure is not a saving; critical categories keep a qualified second source.
Where the category is technology, the same discipline applied to cloud and software spend is covered specifically in Cloud Cost Optimisation & FinOps, including the commitment and licensing traps that a general procurement review misses.
Property, Technology and Services
Three lines that are often large, rarely examined, and slow to change — which is exactly why they should be started early in the eight weeks.
Property. Measure space used against space paid for, by site and by shift. Then read every lease for break dates, rent review dates and dilapidations exposure. A break opportunity inside twelve months is worth more than any negotiation, and consolidation of sites removes running cost as well as rent. Where the business owns property, consider whether it is the right asset for the business to hold at all.
Technology. Licences against active users is the fastest check and usually finds immediate savings. Then look for two tools doing the same job, support tiers above what the business needs, and renewal commitments that have never been examined. Consolidating systems is a larger exercise with a larger payoff, covered in our systems integration service in the IT category.
Professional and financial services. Recurring advisory that is no longer used, insurance priced from loyalty, banking arrangements unchanged for years, and audit or compliance work duplicated across group entities. Small individually, meaningful together, and usually uncontroversial to change.
Structure, People and Automation
People cost is the largest line and the last one to touch — not for sentiment, but because it is the slowest to reverse and the most likely to remove the capability the recovery needs.
Start with structure, not numbers. Spans of control, layers between the frontline and the owner, and duplicated coordination roles across functions. A structure that was right at thirty people is usually wrong at two hundred, and fixing it changes the headcount question from a cut into a redesign.
Treat overtime as a diagnostic. Sustained overtime in one function is a structural gap, not a cost problem. Removing the overtime without filling the gap moves the cost into delays and errors.
Test contractor and agency spend against permanent. Where the need is continuous, agency premium is a poor trade; where it is variable, it is the right one.
Automate the transactional before reducing the people. Invoicing, order entry, reconciliation, reporting and first-line support are the usual candidates, and Enterprise Systems Integration & Tech-Stack Consolidation plus our AI services are how that is delivered properly. Automation that follows a headcount cut usually costs more than the cut saved; automation that precedes it changes the structure permanently.
Handle reductions properly. Statutory process, consultation, notice, redundancy entitlements and outflow support are not optional and are not a place to economise. A badly handled reduction costs more in tribunal exposure, remaining-team productivity and recruitment later than the saving it delivers.
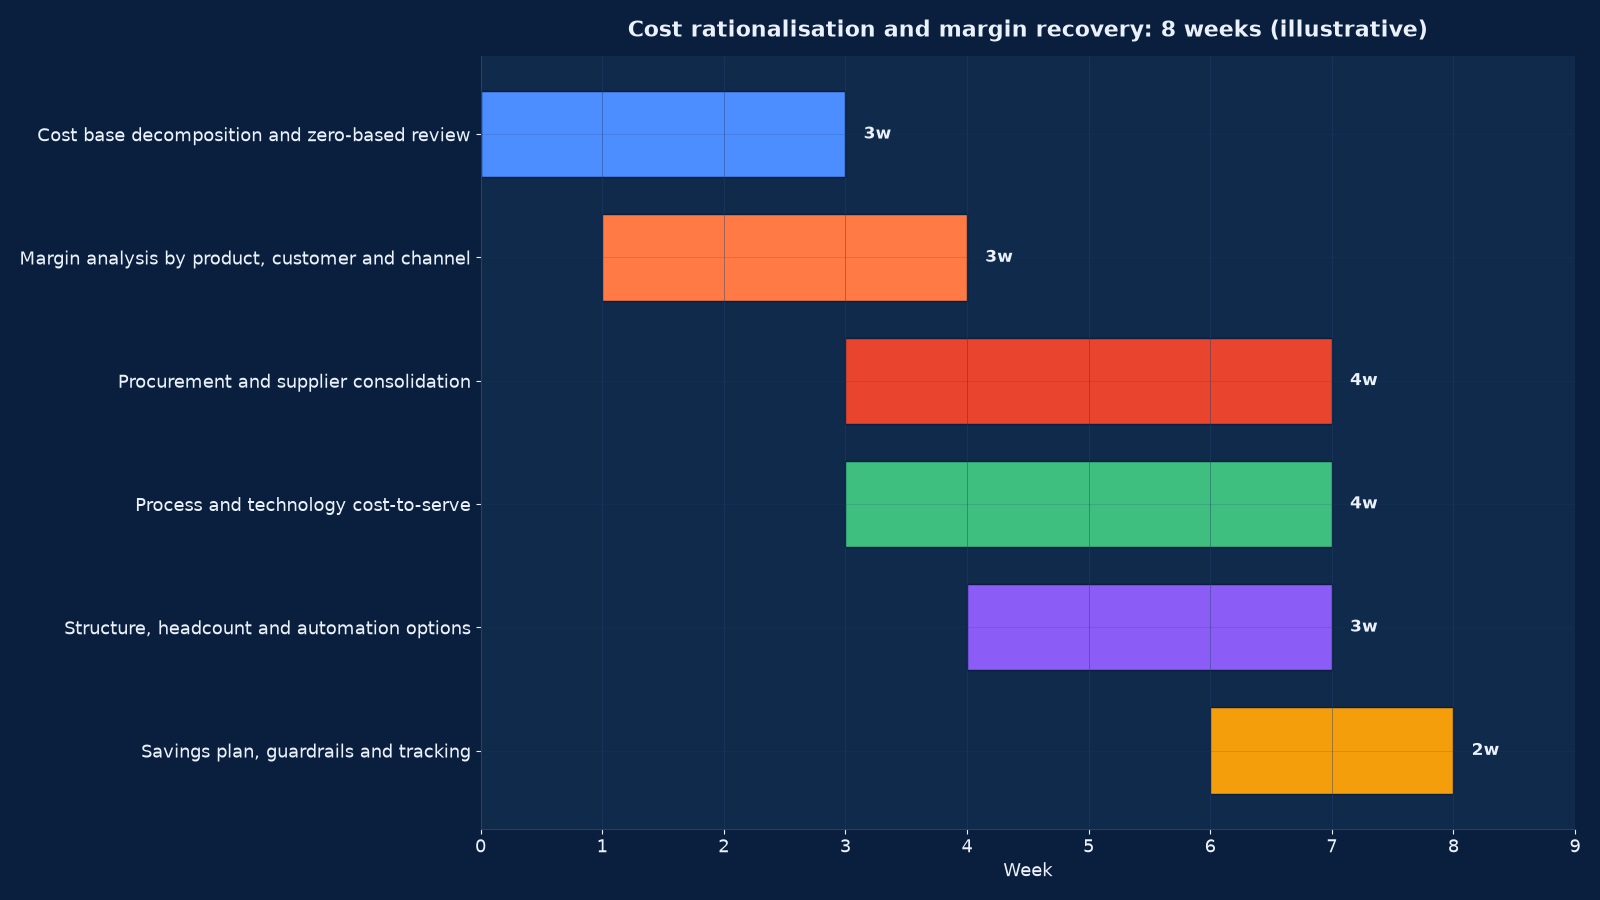
Chart values are an illustrative planning model based on typical UMC engagements and published industry benchmarks. They are not a guarantee of results on any specific project.
The Eight-Week Programme
| Phase | Weeks | Activities | Output |
|---|---|---|---|
| Decomposition | 1–3 | Trial balance detail reviewed, every line classified addressable / contractual / structural, values assigned | A cost map with a value against each opportunity |
| Margin analysis | 2–4 | Contribution by product, customer and channel including cost to serve; discount leakage; contract profitability | The reprice-or-exit list and the mix effect quantified |
| Procurement | 4–7 | Spend analysis, contract coverage, category consolidation, benchmarking, renegotiation of the top ten | Documented savings with supplier agreement |
| Process and technology | 4–7 | Cost to serve per transaction, licence and tooling review, automation candidates | A technology and process savings list with delivery routes |
| Structure and people | 5–7 | Spans and layers, overtime analysis, contractor spend, automation sequencing | A structure proposal rather than a headcount cut |
| Plan and guardrails | 7–8 | Savings plan consolidated with owners and dates, guardrails agreed, tracking mechanism built | An approved plan with a monthly savings report |
Guardrails: What Not to Cut
Every savings plan needs an explicit list of protected spend, agreed before execution rather than argued during it. These are the ones we protect by default.
- Anything that protects cash. Credit control, billing accuracy and collections capacity — cutting these to save cost worsens the cash position they exist to defend.
- Anything that protects delivery to the customers you are keeping. The capacity behind your highest-contribution accounts is not overhead.
- Compliance, statutory and safety obligations. Filings, tax, statutory payments, certifications and safety are not discretionary.
- The measurement capability. If you cannot measure contribution, cost to serve or savings run-rate, you cannot manage the programme — so the finance and analytics capacity that produces those numbers is protected.
- Key people. The individuals whose departure would take knowledge out of the business are identified by name in week one.
- Maintenance of critical assets. Deferred maintenance is borrowing against the asset at an unknown rate.
- The investment that fixes the cause. Automation, systems consolidation and process redesign are how the cost stays out; cutting them to hit a savings number guarantees the cost returns.
A plan without guardrails is executed by whoever is most motivated to hit a number, and that is not how a business should decide what it values.
Making the Savings Stick
Savings decay. The mechanism of decay is ordinary: a supplier is re-added, a role is refilled, a discount is re-approved, a tool is repurchased — each individually reasonable. Four controls prevent it.
Separate run-rate from one-off. A run-rate saving changes the annual cost base and must be visible in the accounts. A one-off gain — a refund, a stock clearance, an asset sale — is cash, not savings. Reporting them together is how programmes claim success that the following year contradicts.
Baseline and reset the budget. The saving must enter the budget baseline immediately. If next year’s budget is built from the old cost base, the saving is spent before it is earned.
Name an owner per saving. Not a department — a person, with the saving in their objectives and in the monthly report.
Track for twelve months. A monthly savings report against the plan, with reversals shown explicitly and explained. Most reversals are visible in month three or four, which is early enough to correct.
This is the same measurement discipline as our cash recovery service and our AI ROI scorecard work: baseline, owner, cadence, evidence. The CEO survey insights on cost pressure and strategic resilience makes the point from the leadership side — cost pressure is constant, so the advantage belongs to businesses that can take cost out repeatedly rather than once.
Measuring the Programme
Figures 1 and 2 use subsets of these. The full set is baselined in weeks one to three and reported monthly thereafter.
| Measure | Definition | Target |
|---|---|---|
| Gross margin | Revenue less cost of sales, by product line | Rising, with the mix effect separated from the price effect |
| Contribution margin by segment | Contribution after cost to serve | Every segment above the floor, or exited |
| Negative-contribution revenue | Share of revenue contributing nothing or less | Measured in week four; repriced or removed within a quarter |
| SG&A ratio | SG&A as a share of revenue | Falling without capacity loss |
| Cost to serve per transaction | Fully loaded cost per order, ticket or delivery | Falling quarter on quarter |
| Addressable spend under contract | Share of third-party spend with documented terms | Above 80% |
| Run-rate savings delivered | Savings evidenced in the accounts, not projected | Against plan, reported monthly |
| Savings reversal rate | Share of claimed savings that have returned | Below 10% at twelve months |
| Discount leakage | Gap between approved and invoiced price | Closing |
| Overtime share | Overtime as a share of total people cost | Falling, with the structural gaps filled |
Report run-rate savings separately from one-off gains, and keep the baseline fixed for twelve months so the comparison stays honest. Growth confuses everything: rising total cost with a falling SG&A ratio and a rising contribution margin is usually a success, and the reverse is usually a problem — but neither is visible without the ratio measures.
Engagement Models
| Model | Duration | Deliverables | Best when |
|---|---|---|---|
| Cost and margin diagnostic | 2–3 weeks | Cost-base classification, contribution analysis by customer and product, prioritised savings list with values | You need the number before committing to a programme |
| Full eight-week programme | 8 weeks | All six phases with an approved savings plan, guardrails and the tracking mechanism | The standard engagement where margin is falling or cost is out of control |
| Margin recovery only | 4–6 weeks | Contribution and cost-to-serve analysis, reprice-or-exit list, discount authority redesign, contract renegotiation support | Revenue is fine and profit is not |
| Procurement and category review | 4–8 weeks | Spend analysis, contract coverage, consolidation and renegotiation of the top categories | Third-party spend is material and unmanaged |
| Savings delivery support | 3–6 months | Execution alongside your team with monthly run-rate reporting | The plan exists but internal capacity to deliver it does not |
| Ongoing cost and margin management | Monthly | Savings tracking, reversal monitoring, quarterly category reviews | You want the discipline maintained rather than restarted |
What Good Looks Like After Eight Weeks
The programme has worked when the business can take cost out deliberately rather than reactively.
- Every cost line is classified addressable, contractual or structural, with a value and an owner against the addressable ones.
- Contribution is known by product, customer and channel, including cost to serve, and the negative-contribution list has been repriced or exited.
- Discount authority has thresholds, and the gap between approved and invoiced price is measured.
- Procurement spend is mapped by supplier and category, with the top categories contracted and benchmarked.
- The savings plan has named owners, dates, guardrails and a monthly report separating run-rate from one-off.
- The budget baseline has been reset so the savings are not spent before they are earned.
- Structure has been redesigned rather than merely reduced, and the automation that removes the cost permanently is scheduled.
- Nobody has to guess what a customer or a product is worth.
Two follow-ons usually apply. Where the savings are needed for cash rather than for margin, the cash flow and working capital programme converts them into liquidity. Where the cause is that nobody owned the numbers in the first place, the unified operating layer is what stops the cost returning — and our AI transformation strategy piece covers how much of the transactional cost base is now automatable, which changes what the structure should look like in three years rather than eight weeks.
Frequently Asked Questions About Cost Rationalisation & Margin Recovery
How much can we realistically save?
On an addressable cost base that has not been reviewed in three or more years, five to fifteen per cent of total cost is typical, and the margin side frequently produces more than the cost side. On a business that runs procurement properly and measures contribution, two to five per cent is the honest answer. Anyone quoting a fixed percentage before seeing the trial balance detail and the customer contribution is guessing.
How quickly do savings appear?
Licence and subscription removal, unbilled recoveries and obvious duplication show in the first three weeks. Procurement renegotiation four to eight. Property actions depend on lease dates and can take months. Structural change one to two quarters. We report run-rate savings monthly, separately from one-off gains, so what has actually landed is never confused with what has been identified.
Will cost cutting damage our growth?
It can, which is why the guardrails exist and why the margin analysis runs before the cuts. Removing negative-contribution revenue can improve profit while reducing revenue, and that is usually the right trade — but it should be a decision made with the numbers, not a surprise. Capacity that serves your profitable customers is protected by name, not by category.
Should we start with headcount?
Usually last. People cost is the largest line and the slowest to reverse, and cutting it first removes the capability needed to deliver everything else. Start with structure — spans, layers and duplication — because fixing the structure changes the headcount question from a cut into a redesign, and often reduces cost without reducing capacity.
What is zero-based budgeting and do we need it every year?
Zero-based means each cost has to justify itself against what it delivers today rather than against last year’s budget. Doing it fully every year is expensive and produces fatigue; doing it on a rotating basis — two or three cost categories a year, plus a full review when margin moves materially — captures most of the benefit. What you need every year is the classification: addressable, contractual, structural.
How do we handle suppliers who will not move on price?
Then the lever is consolidation or specification rather than price. Moving volume to fewer suppliers makes you worth negotiating with; changing specification, order pattern or lead time changes the supplier’s cost to serve you, which is a more durable basis for a price change than a request. And benchmark the price first — a supplier who will not move may already be the cheapest.
Our margin is falling but our prices have not changed. Why?
Three usual causes: input costs rose and were not passed through, the mix shifted towards lower-margin products or customers, or cost to serve grew because of exceptions, customisation and support that nobody priced. The margin analysis separates all three, which matters because each has a different fix — indexation for the first, portfolio decisions for the second, and process or pricing change for the third.
Do you implement the savings or just recommend them?
Both, depending on the model. The eight-week programme ends with an approved plan, owners and a tracking mechanism; delivery support then executes alongside your team for three to six months with monthly run-rate reporting. Where internal capacity is the constraint, that second stage is what makes the difference between a report and a changed cost base.
How does this relate to your cloud cost and FinOps service?
Same discipline, different cost base. FinOps applies the classify-measure-own-track pattern to cloud and technology spend, where the levers are tagging, right-sizing, commitments and architecture. If technology is a material line in your cost base, run both: the general programme will find the unused licences and the duplicated tools, and FinOps will find the structural savings inside the infrastructure that a general review cannot see.
What about automation and AI — should we cut first and automate later?
Automate first where you can. Cutting the people and then automating the work usually costs more overall, because you pay twice and lose the knowledge needed to specify the automation. Where cash forces the order, cut with the automation plan attached and the roles explicitly identified for transfer, so the reduction is a step in a redesign rather than an end in itself.
What should we do first?
Two weeks of decomposition and margin analysis: classify every cost line, and calculate contribution by customer and product including cost to serve. That alone usually identifies the three largest opportunities and tells you whether your problem is cost, price or mix — which is the question that determines everything after it.
Book a Cost and Margin Diagnostic
Send us your trial balance detail and your revenue by customer and product. In two to three weeks we will classify the cost base, calculate contribution including cost to serve, and give you a prioritised savings list with a value against each item and a guardrail list of what must not be cut to get it.
Contact Unified Management Consulting to arrange a confidential first conversation.
Related Services
Cost rationalisation and margin recovery connects to our other consulting and technology services:
- Mr Avinash Sharma — who leads cost and margin engagements
- Risk, Governance & Business Continuity Support — the governance that keeps savings from reversing
- Business Strategy Consulting — where the answer is portfolio change rather than cost reduction
- Data Science Services for Business Analytics — the contribution and cost-to-serve measurement layer
- Cloud Cost Optimisation & FinOps — the same discipline applied to technology spend
- Enterprise Systems Integration & Tech-Stack Consolidation — removing duplicate systems and the cost that comes with them
- Conversion Rate Optimisation (CRO) — improving revenue per unit of marketing spend, the margin lever on the demand side
- Unified Top-Level Business Management & Handling — one operating layer across finance, operations and people, with decision rights and cadence
- 30-Day Turnaround Diagnostic — thirty days to an evidenced position across cash, cost, margin, contracts and governance
- Cash Flow & Working Capital Recovery — a thirteen-week forecast, receivables and payables discipline, inventory release and covenant cover
- Distressed Business Restructuring — the options ladder from consensual standstill to formal insolvency, with lender and stakeholder plans
- Interim & Fractional Leadership — a written mandate with published decision rights for CEO, COO, CFO and transformation roles
- Predictive Analytics & Demand Forecasting — use case selection, naive baselines, walk-forward validation, prediction intervals and model operations
- BI Dashboards & Executive Reporting — metric definitions, a governed semantic layer, three reporting tiers and the retirement of superseded spreadsheets