
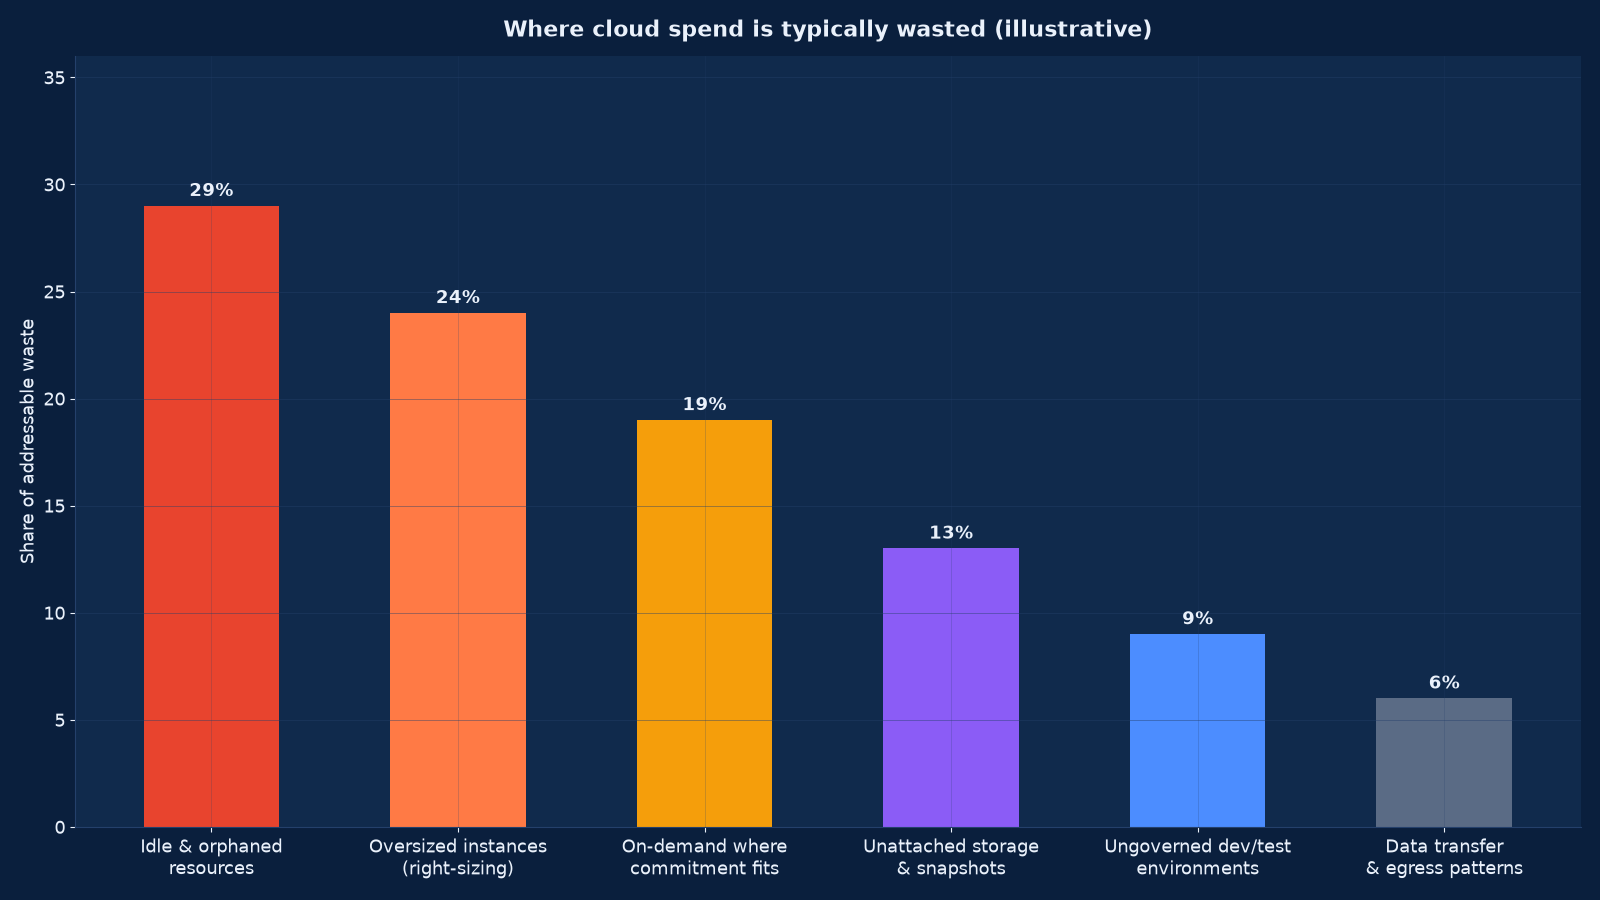
Chart values are an illustrative planning model based on typical UMC engagements and published industry benchmarks. They are not a guarantee of results on any specific project.
Cloud spend does not fail because someone bought the wrong instance. It fails because nobody could say which team, which product or which customer a given rupee belonged to. Cost you cannot attribute is cost you cannot manage.
Cloud cost optimisation is the engineering side: finding and removing waste without breaking anything. FinOps is the operating model that keeps it removed: tagging, allocation, showback, budget ownership and a cadence that makes cost a shared responsibility rather than a monthly surprise. Unified Management Consulting delivers both — a measured first pass that produces real savings, and the operating model that stops the spend returning.
💸 Cloud Cost Optimisation & FinOps — Quick Summary
| Component | What We Deliver |
|---|---|
| Cost telemetry & tagging | Resource-level cost data collected, a tagging standard defined and enforced, and untagged resources identified and attributed to owners. |
| Allocation & showback | Cost allocated to teams, products, environments and customers, reported monthly with trend and unit economics rather than as a single invoice total. |
| Waste identification | Idle and orphaned resources, oversized instances, unattached storage, stale snapshots, forgotten dev and test environments and abandoned projects — each with an owner and a saving value. |
| Right-sizing | Utilisation-based instance, storage and database recommendations, tested in non-production before change, with rollback defined. |
| Commitment strategy | Reserved instances, savings plans and committed-use discount modelling against forecast usage, with the flexibility cost stated honestly. |
| Storage lifecycle | Tiering policies, snapshot retention, object lifecycle rules and archive strategy, modelled including retrieval cost. |
| Architecture review | Egress patterns, cross-region traffic, data transfer between services, and the designs where cost is structural rather than incidental. |
| Budgets & anomaly detection | Budgets owned by the people who cause the cost, with alerting that fires before the month ends rather than after. |
| Operating cadence | A monthly review, a quarterly commitment decision and an annual architecture review, with measured savings tracked to realisation. |
This service sits alongside Cloud Services & Migration and DevOps & CI/CD Engineering Services. The measurement discipline is the same one described in AI ROI Measurement & Executive Scorecards, and where AI workloads are driving inference spend, that page covers the run-rate modelling specifically.
Why Cloud Spend Grows Faster Than Usage
Cloud cost growth is rarely a single bad decision. It is the accumulation of individually reasonable ones, in an environment where adding cost is easy and removing it requires effort.
| Reason | What it looks like | Why it persists |
|---|---|---|
| No tagging standard | Sixty per cent of spend cannot be attributed to a team or product | Tagging is everyone’s job and therefore nobody’s |
| Provisioning is frictionless | An environment created for a two-week trial is still running eighteen months later | Creation takes minutes; decommissioning requires finding the owner |
| Sizing chosen for safety | Instances at eight per cent average CPU because nobody wants to be the person who undersized | The cost of oversizing is diffuse; the cost of undersizing is personal |
| No unit economics | Total spend is known; cost per customer, transaction or feature is not | The data exists but nobody has joined it to the business metric |
| Dev and test always on | Non-production environments run twenty-four hours for a team that works eight | Scheduling is seen as an inconvenience rather than a control |
| Commitments bought early | Reserved capacity against a forecast that changed | Discount pursuit without usage forecasting |
| Egress ignored | Cross-region and cross-service transfer accumulating quietly | It is a small line item until it is not |
| No owner for the number | Finance reports the total; engineering owns the causes | The accountability gap is structural, not personal |
The structural point is the last row. When finance owns the number and engineering owns the causes, neither party has both the information and the incentive. FinOps exists to close that gap by giving cost visibility to the people who can change it, which is why the operating model matters as much as the optimisation pass.
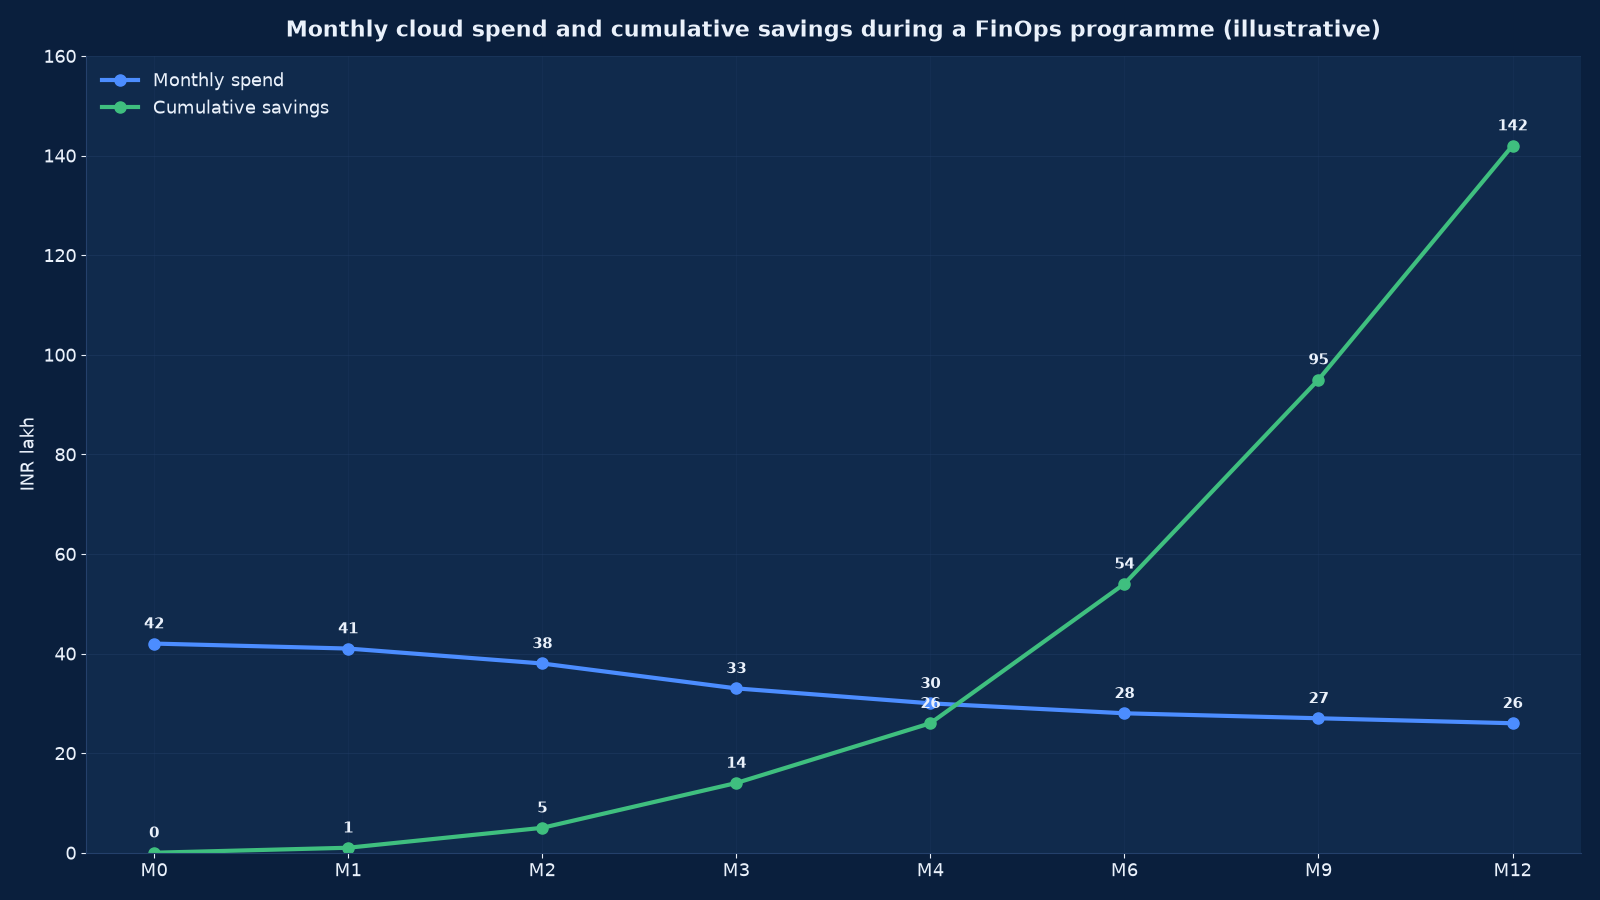
Chart values are an illustrative planning model based on typical UMC engagements and published industry benchmarks. They are not a guarantee of results on any specific project.
The FinOps Operating Model: Inform, Optimise, Operate
These three stages are the standard FinOps lifecycle, and the order matters. Optimising before you can attribute cost produces savings you cannot verify and decisions you cannot defend.
| Stage | Focus | Typical duration | What it produces |
|---|---|---|---|
| Inform | Visibility: telemetry, tagging, allocation, showback, baselines | Weeks 1–6 | An attributed cost baseline and a waste register with values |
| Optimise | Action: right-sizing, waste removal, scheduling, commitments, storage tiering | Weeks 4–16 | Realised savings, verified against the baseline |
| Operate | Cadence: budgets owned by teams, anomaly detection, monthly review, unit economics | Ongoing | Sustained control, with savings tracked to realisation rather than projection |
Most organisations attempt to start at Optimise, because that is where the savings are. The result is a set of changes made against an unattributed bill: something is switched off, nobody is sure whose it was, and either it comes back on or an outage follows. Six weeks of Inform work is what makes the next sixteen safe.
The Optimisation Levers, In Order of Value
Figure 3 shows the distribution across a typical first year. The order below is the order we work in, because each lever depends on the visibility produced by the previous one.
| Lever | How it works | Typical share of savings | Risk to manage |
|---|---|---|---|
| Idle and orphaned cleanup | Identify unattached volumes, unused elastic IPs, empty load balancers, abandoned environments and zero-traffic services | Largest single lever early on | Something looks idle but is a failover path — confirm with the owner before removing |
| Right-sizing | Match instance, database and storage class to measured utilisation rather than to a guess | Second largest | Peak behaviour matters more than average; test before changing production |
| Commitment strategy | Reserved instances and savings plans against a forecast usage baseline | Substantial and durable | Lock-in: a commitment against a forecast that changes becomes waste you have already paid for |
| Scheduling non-production | Auto-shutdown outside working hours and at weekends for dev, test and staging | Consistent, roughly two thirds of non-production cost | Teams working outside standard hours need an override route |
| Storage tiering and lifecycle | Move infrequently accessed data to cheaper tiers, expire snapshots, cap retention | Grows over time | Retrieval cost and latency — model both, not just the storage price |
| Spot and preemptible capacity | Use interruptible capacity for stateless, batch or fault-tolerant workloads | Large where applicable | Only for workloads that tolerate interruption; never for stateful primary systems |
| Egress and network design | Reduce cross-region transfer, co-locate services, cache at the edge | Small until it is not | Requires architecture change rather than configuration |
| Data transfer and pipeline review | Eliminate redundant movement between services and unnecessary replication | Moderate | Some replication is a resilience control — do not remove it for cost alone |
Two cautions. Do not optimise a resilience control by accident. Cross-region replication, standby capacity and retained snapshots often look like waste in a utilisation report and are actually the recovery capability described in our backup and disaster recovery service. Confirm the purpose before removing. Commitments are a forecast, not a saving. A reserved instance against usage that later falls is a cost you have already committed to, so model the downside case as well as the discount.
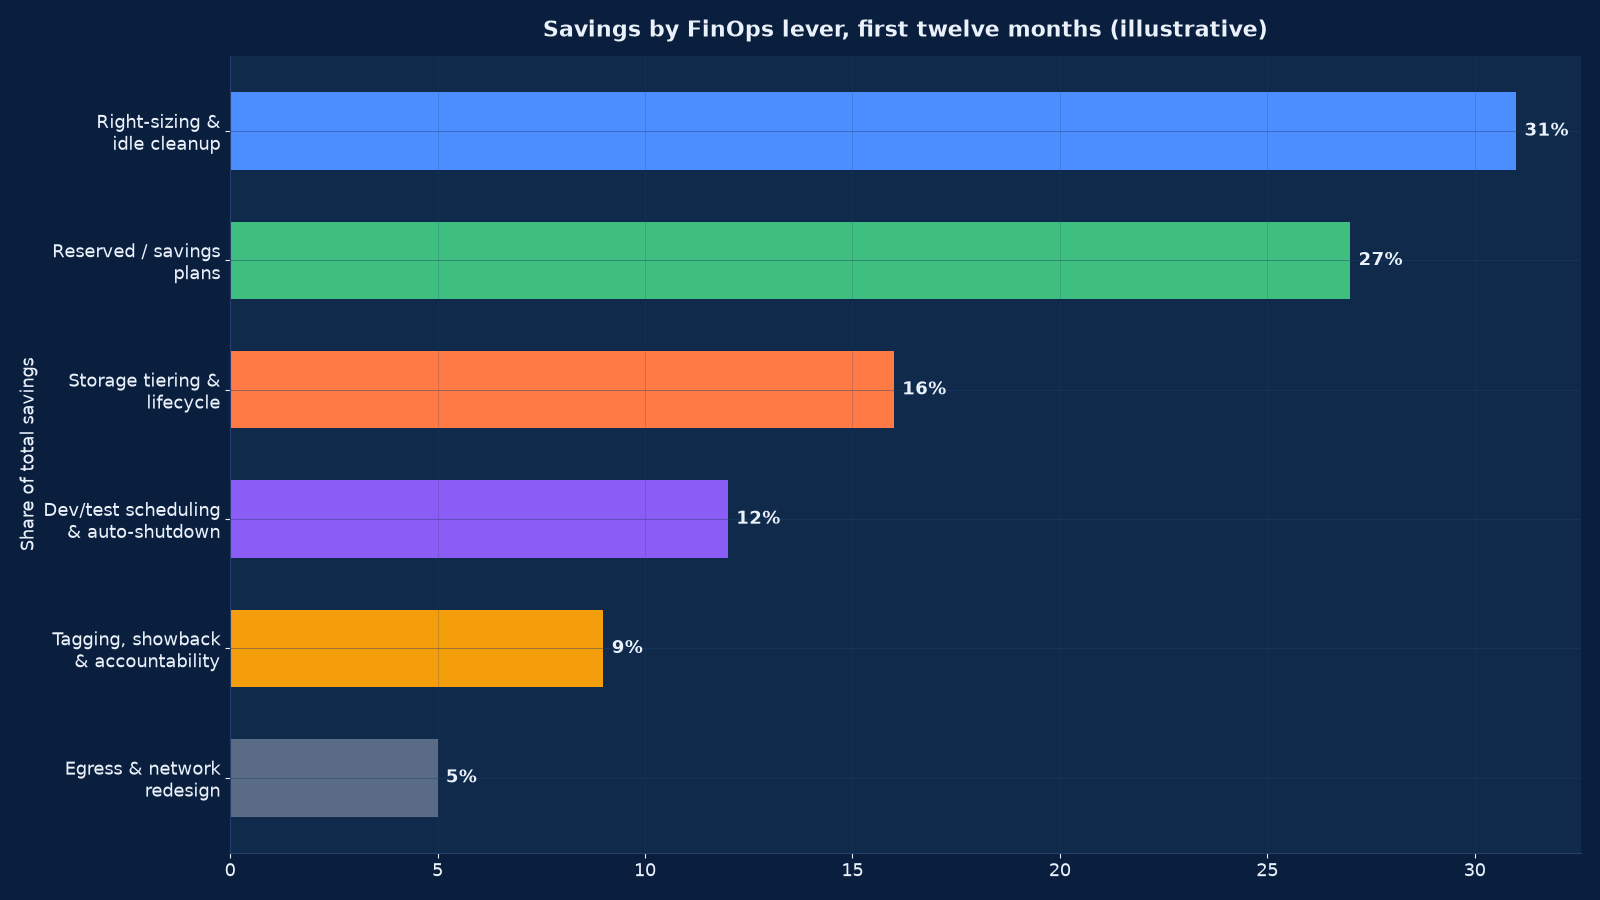
Chart values are an illustrative planning model based on typical UMC engagements and published industry benchmarks. They are not a guarantee of results on any specific project.
Tagging and Allocation: The Foundation
Tagging is unglamorous and it is the whole exercise. Without it, every saving is unverifiable and every budget is arbitrary.
| Tag dimension | Purpose | Example values | Enforced by |
|---|---|---|---|
| Owner | Who is accountable for this resource and its cost | Team or named individual | Policy at creation; untagged resources blocked or flagged |
| Environment | Separates production from non-production cost and risk | prod, staging, test, dev, sandbox | Automated from the deployment pipeline |
| Application / product | Attributes cost to the thing being built | Product or service identifier | Pipeline injection |
| Cost centre | Maps to the finance structure for reporting | Finance-defined code | Applied from owner mapping |
| Customer | Enables per-customer margin where the service is multi-tenant | Tenant identifier | Application layer, since infrastructure is often shared |
| Data classification | Links cost to sensitivity for governance decisions | public, internal, confidential, restricted | Policy with security review |
| Expiry / review date | Forces a decision on temporary resources | Date after which the resource is reviewed or removed | Required on non-production creation |
Three rules make tagging hold. Enforce at creation through policy rather than asking people to remember — a tagging standard that depends on discipline fails within a quarter. Automate from the pipeline wherever possible, because pipeline-injected tags are accurate and human-applied tags are not. Publish the untagged list monthly with an owner against each item; visibility closes the gap faster than any policy.
Showback, Chargeback and Unit Economics
Reporting cost to the teams that cause it changes behaviour more reliably than any technical control. The three levels differ in consequence.
| Level | What it is | Effect | Prerequisite |
|---|---|---|---|
| Cost visibility | A dashboard finance and engineering both see | Awareness; modest behaviour change | Tagging |
| Showback | Each team receives a monthly statement of its own cost with trend | Accountability without financial consequence; reliable behaviour change | Allocation rules and a named owner per team |
| Chargeback | Teams are actually billed from their own budget | Strong behaviour change, and strong resistance | Mature allocation, agreed rates and finance process support |
| Unit economics | Cost expressed per customer, transaction, order or active user | The only view that connects cloud spend to commercial performance | Business metrics joined to cost data |
Most organisations should implement showback and unit economics, and think carefully before chargeback. Chargeback produces gaming — teams shifting workloads to avoid attribution — unless the allocation is trusted, and it takes a year to earn that trust.
Unit economics is the more valuable target. “Cloud spend rose eleven per cent” is not a decision-useful statement; “cost per active customer fell four per cent while volume rose fifteen” is. Joining cost to the business metric is a data problem, and it is the same discipline as Data Science Services for Business Analytics applied to infrastructure telemetry.
Common Mistakes
| Mistake | Consequence | Better approach |
|---|---|---|
| Cutting before tagging | Savings cannot be attributed, and something important gets removed | Six weeks of Inform first, however impatient the finance team is |
| Optimising on average utilisation | Peak load causes an outage after the downsize | Size against p95 or p99 utilisation and known seasonal peaks |
| Buying commitments before forecasting | Committed capacity against usage that fell | Model the baseline and the downside; start with partial coverage and increase |
| Treating replication as waste | A resilience control removed for a small saving | Confirm purpose with the owner; resilience spend is a decision, not an inefficiency |
| One-off programme with no cadence | Spend returns within two quarters | Monthly review, owned budgets and anomaly detection as standing operations |
| Ignoring retrieval and egress cost | A storage saving that costs more on restore | Model total cost of ownership including retrieval, per our DR guidance |
| Central team makes all decisions | Engineering disengages and the central team becomes a bottleneck | Central team provides data and options; owners decide |
| Reporting totals only | Nobody can act on a number they cannot decompose | Report by team, product, environment and unit |
AI and Data Workloads: A Different Cost Shape
Inference and data processing costs behave differently from traditional infrastructure, and the controls that work for VMs do not transfer directly.
- Cost per transaction, not per hour. Inference spend scales with usage and context length, so the unit to manage is cost per request or per case, and the lever is prompt and context design rather than instance size.
- Model selection is a cost decision. Routing straightforward requests to a smaller model and reserving the largest for genuinely hard cases typically reduces inference spend materially with no measurable quality loss — but it requires an evaluation set to prove that.
- Caching is the highest-yield control. Repeated queries and embeddings are frequently recomputed for no reason. Semantic and exact-match caching both help.
- Batch where latency allows. Batch inference and scheduled processing are substantially cheaper than on-demand for anything not user-facing.
- Data movement dominates pipelines. In analytics workloads the cost is often in scanning and moving data rather than in compute, so partitioning, column pruning and materialisation matter more than instance choice.
- Vector indices have a storage and query cost curve. They grow with corpus size and are queried constantly; sizing them is an architecture decision, not a configuration one.
Our Data Engineering for AI: RAG & Knowledge Systems service covers the corpus and retrieval design that determines much of this cost, and our analysis of AI agent production economics documents how often the run-rate diverges from the pilot estimate.
The Operating Cadence
Savings decay without a cadence. This is the rhythm we hand over, and the monthly review is the one that must not lapse.
| Cadence | Activity | Participants | Output |
|---|---|---|---|
| Weekly | Anomaly review: unexpected spend spikes, new untagged resources, failed commitments | Platform lead | Actions raised with owners |
| Monthly | Showback review: cost by team, product and environment, trend, unit economics, waste register progress | Team owners with finance and platform | Decisions on the waste register and budget variances |
| Quarterly | Commitment review: forecast against actual, coverage decision, savings plan renewal | Finance with platform | Commitment purchase or release decision |
| Quarterly | Architecture cost review: the designs where cost is structural | Architecture with product owners | Backlog items with costed benefit |
| Annually | Full optimisation pass and vendor negotiation, including private pricing and enterprise agreements | Finance, platform, procurement | Refreshed baseline and negotiated terms |
The monthly review needs three things to survive: a named chair, a fixed agenda covering variance, waste register progress and unit economics, and consequences for decisions — an item left open three months running should escalate rather than be re-discussed.
Governance: Preventing the Spend Returning
Optimisation is a project; governance is what makes it durable. Four controls matter.
Budgets owned by the people who cause the cost. A central cloud budget produces a central argument. Team-owned budgets with alerts at sixty, eighty and one hundred per cent produce decisions at the right level.
Policy as code. Allowed instance families, maximum sizes without approval, mandatory tags, default shutdown for non-production and retention limits enforced automatically rather than by review. DevOps & CI/CD Engineering Services is where that enforcement lives.
Approval thresholds with a fast path. Blocking everything creates shadow provisioning; allowing everything creates sprawl. A threshold with an automatic fast path below it and a documented review above it is the workable middle.
Cost in the definition of done. New services specify an expected cost, a tagging plan and a shutdown strategy at design time. Retrofitting all three is several times the effort.
Where the estate is also being consolidated, the systems integration service in this category produces overlapping savings — duplicate SaaS and duplicate infrastructure are frequently the same problem seen from two directions.
Vendor Negotiation and Multi-Cloud Reality
Commercial terms are a real lever, but they come late and they depend on the data.
- Negotiate from attributed spend, not total spend. A provider discounts committed growth; you cannot commit credibly without a forecast, and you cannot forecast without allocation.
- Private pricing and enterprise agreements become available at material spend levels and typically beat published reserved pricing — but they usually require a commitment, so model the downside.
- Multi-cloud is rarely a cost strategy. It is a resilience, negotiating or capability strategy. Running the same workload in two providers for price arbitrage usually costs more in engineering than it saves in discounts.
- Repatriation is sometimes correct. For steady, predictable, high-volume workloads, owned or colo infrastructure can be materially cheaper. The honest comparison includes the operational cost of running it, which is what our managed IT service covers.
- Exit cost is real. Egress charges and rewrite effort make leaving expensive. Factor that into the commitment decision rather than discovering it at renewal.
Where the question is whether to be in cloud at all, Cloud Services & Migration covers the assessment, and Computing, Server, Storage & Data Centre Engineering covers the on-premises alternative properly rather than as a straw man.
Measuring the Programme
These are the measures we baseline in the Inform stage and report monthly thereafter.
| Measure | Definition | Why it matters |
|---|---|---|
| Attributed spend | Share of total cost attributable to a team, product or customer | Below ninety per cent, nothing else can be managed |
| Waste register value | Identified waste with an owner, and the share closed | Separates finding waste from removing it |
| Realised savings | Verified reduction against the baseline, not projected | The only number finance should accept |
| Unit cost | Cost per customer, transaction, order or active user | Connects spend to commercial performance |
| Commitment coverage and utilisation | Share of eligible spend covered, and share of commitment consumed | Unused commitment is waste you have pre-paid |
| Idle resource count | Resources with no traffic or utilisation over a defined window | A leading indicator of governance health |
| Non-production run hours | Hours dev and test environments actually run | The scheduling lever, measured |
| Anomaly detection time | Time from a spend anomaly to someone being alerted | A runaway job should cost hours, not a month |
| Forecast accuracy | Variance between forecast and actual monthly spend | Determines whether commitments can be bought safely |
Report realised savings separately from identified savings, and keep the baseline fixed for at least twelve months so the comparison stays honest. Growth confuses everything: a rising total spend with a falling unit cost is usually a success, and the reverse is usually a problem, but neither is visible without the unit measure.
Engagement Models
| Model | Duration | Deliverables | Best when |
|---|---|---|---|
| Cloud cost assessment | 3–4 weeks | Cost telemetry review, tagging gap analysis, waste register with values, commitment position, forecast and a prioritised savings plan | You need the number before committing to a programme |
| Full optimisation pass | 10–16 weeks | Tagging enforcement, allocation and showback, right-sizing, waste removal, scheduling, commitment strategy and storage lifecycle — with savings verified | Spend is material and nobody owns it |
| FinOps operating model | 6–10 weeks | Budget ownership model, showback or chargeback design, policy as code, cadence, tooling selection and team enablement | Savings were achieved once and returned |
| Unit economics build | 4–6 weeks | Business metrics joined to cost data, cost per customer or transaction, margin view by product | The board asks what the cloud spend is buying |
| Ongoing FinOps management | Monthly | Anomaly monitoring, monthly review facilitation, waste register maintenance, quarterly commitment decisions | You want the capability operated rather than merely designed |
What a Mature FinOps Function Looks Like
Twelve months in, the conversation changes shape. Nobody asks what the cloud bill is; they ask what the cost per order is and whether the new feature is worth its infrastructure.
- Over ninety per cent of spend is attributed to a team, product or customer, enforced by policy rather than by request.
- Every team sees its own cost monthly with trend, and owns a budget with alerts.
- Unit cost is reported alongside volume, so growth and efficiency are distinguishable.
- The waste register is maintained continuously, with items closed rather than re-identified.
- Commitments are reviewed quarterly against a forecast whose accuracy is measured.
- Anomaly detection fires within hours, and a runaway job costs an afternoon rather than a month.
- New services arrive with a cost estimate, a tagging plan and a shutdown strategy already decided.
- The monthly review has a named chair and produces decisions with consequences.
That last point is the difference between a FinOps practice and a cost report. Where infrastructure cost is only one part of a wider AI or data programme, the same measurement discipline extends to inference run-rate and internal supervision time — covered in our AI ROI service, which builds the executive view that this one feeds. Our technology consulting guide covers how to evaluate providers on these questions before you commit, and the Nscale capacity story is a reminder that unit cost in AI infrastructure is as much about supply as about configuration.
Frequently Asked Questions About Cloud Cost Optimisation & FinOps
How much can we realistically save?
For an estate that has never been optimised, twenty to forty per cent of addressable spend in the first year is typical, with most of it arriving in months two to five from waste removal and right-sizing. For an estate already managed, five to fifteen per cent is more honest, and the greater value is in unit economics and governance. Anyone quoting a fixed percentage before seeing your tagging position is guessing.
How long before we see savings?
Idle-resource cleanup and scheduling produce savings within two to four weeks. Right-sizing takes six to ten weeks because it needs testing. Commitment strategy is a quarterly decision and should not be rushed. Figure 2 shows the typical shape: fast initial gains from waste, then a flatter curve as the structural work takes over.
Is FinOps just cost cutting?
No, and treating it that way is why programmes fail. FinOps is about making cost a visible, owned, decision-useful number so that spending more can be the right answer when it earns more. A team that can see its cost per transaction can justify doubling its infrastructure; a team reading a single monthly total cannot justify anything.
Do we need a FinOps platform or tool?
Not to start. Native cost management tools plus a tagging standard and a monthly review get most organisations through the first year. A dedicated platform earns its cost when the estate is multi-cloud, the allocation rules are complex, or you need unit economics joined to business metrics at scale. Decide from the reporting you cannot produce, not from the feature list.
Will right-sizing cause performance problems?
It can, which is why it is done against p95 or p99 utilisation and known seasonal peaks rather than averages, tested in non-production first, with a rollback defined. Downsizing on average utilisation is the classic mistake: a system at eight per cent average CPU may still have a monthly batch window that needs every core.
Should we buy reserved instances or savings plans?
Only against a forecast you trust, and only for the stable baseline rather than the whole estate. Start with partial coverage, measure forecast accuracy for two quarters, then increase. An unused commitment is waste you have already paid for, and it does not appear in a utilisation report the way an idle instance does.
How do we stop the savings reversing?
With the operating model rather than the optimisation pass: budgets owned by the teams that cause the cost, policy-as-code guardrails on instance sizes and mandatory tags, default shutdown for non-production, anomaly alerting, and a monthly review with a named chair. Without those, spend returns within two quarters because every individual addition still looks reasonable.
What about multi-cloud — does it reduce cost?
Rarely, on its own. Running the same workload across two providers for arbitrage usually costs more in engineering than it saves in discounts. Multi-cloud earns its keep for resilience, negotiating leverage or specific capabilities. If cost is the driver, consolidate first and negotiate from attributed spend.
How do we handle AI inference costs?
Manage cost per request rather than per hour. The main levers are model routing (smaller models for straightforward requests), caching repeated queries and embeddings, batching where latency allows, and controlling context length, which drives token count more than anything else. All of them need an evaluation set so you can prove quality did not degrade — see our AI ROI service for the measurement side.
Should we consider leaving cloud for some workloads?
Sometimes, and the honest comparison includes the operational cost of running it yourself. Steady, predictable, high-volume workloads can be materially cheaper on owned or colo infrastructure. Egress charges and rewrite effort make exit expensive, so factor both into the decision rather than discovering them at renewal.
Who should own cloud cost?
The teams that cause it, with a central function providing data, options and guardrails. A central team that makes all the decisions becomes a bottleneck and engineering disengages; a purely federated model with no central visibility produces the sprawl you are trying to fix. Showback plus owned budgets is the workable middle for most organisations.
What should we do first?
Establish how much of your spend you can currently attribute. If the answer is under ninety per cent, tagging and telemetry are the first six weeks of work and nothing else will be verifiable until they are done. If attribution is already good, start with the waste register — it produces savings in weeks and gives the programme credibility for the slower structural work.
Book a Cloud Cost Assessment
Send us three months of billing detail and access to read-only cost telemetry. We will tell you how much of your spend you can currently attribute, put a value on the waste we can identify without changing anything, and give you a prioritised savings plan with the risk stated against each item.
Contact Unified Management Consulting to arrange an initial assessment of your environment.
Related Services
Cloud cost optimisation connects directly to our infrastructure and data services:
- Cloud Services & Migration (AWS, Azure, GCP) — the platform work that determines the cost shape
- DevOps & CI/CD Engineering Services — policy as code, pipeline tagging and automated guardrails
- Computing, Server, Storage & Data Centre Engineering — the on-premises alternative, costed honestly
- Data Science Services for Business Analytics — joining cost telemetry to business metrics
- AI ROI Measurement & Executive Scorecards — the executive measurement discipline this service feeds
- Data Engineering for AI: RAG & Knowledge Systems — corpus and retrieval design that determines inference and index cost
- Risk, Governance & Business Continuity Support — ensuring resilience controls are not removed as waste
- Managed IT Infrastructure & IT AMC — 24×7 monitoring, patching, backup verification and monthly SLA reporting at a fixed cost
- Enterprise Systems Integration & Tech-Stack Consolidation — application inventory, integration architecture, decommissioning and measured savings
- IT Audit, Compliance & ISO 27001 / SOC 2 Readiness — Annex A gap analysis, control design, evidence automation and certification support
- Backup, Disaster Recovery & Business Continuity — business impact analysis, RTO and RPO tiering, immutable copies and tested runbooks
- IT Helpdesk & End-User Support — tiered service desk, published SLAs, knowledge management and shift-left automation
- Cost Rationalisation & Margin Recovery — cost-base decomposition, contribution by customer and product, cost to serve and pricing discipline
- Data Warehouse & Lakehouse Build — source profiling, bronze-silver-gold layers, conformed dimensions, quality tests, lineage and cost engineering
- BI Dashboards & Executive Reporting — metric definitions, a governed semantic layer, three reporting tiers and the retirement of superseded spreadsheets