
Turn complex data into clearer decisions, measurable performance, and profitable action. Unified Management Consulting provides data science services for business analytics and decision-making, combining data engineering, statistical analysis, machine learning, forecasting, visualization, experimentation, automation, governance, and management consulting.
Businesses collect data from websites, applications, CRM systems, finance platforms, operations, marketing channels, customer service, supply chains, sensors, surveys, and external sources. The challenge is not simply having more data. It is knowing which data is reliable, which questions matter, which patterns are meaningful, what action should follow, and how to communicate the result to the people responsible for making decisions.
📋 Data Science — Quick Summary
| Service | What We Do |
|---|---|
| Predictive Analytics | Machine learning models for forecasting, churn prediction, and demand planning |
| Business Intelligence | Dashboards, reporting, data warehousing, and ETL pipeline development |
| AI/ML Solutions | NLP, computer vision, recommendation engines, and custom AI model development |
| Data Engineering | Data pipelines, data lakes, real-time streaming, and data quality management |
| Key Results | 30% better decisions, 25% cost reduction, 40% faster time-to-insight |
| Investment | $10,000-$100,000+ per project depending on scope |
Unified Management Consulting helps organizations move from fragmented reporting to decision intelligence. We build analytics systems that connect business questions with trusted data, useful models, clear visualizations, practical recommendations, and measurable outcomes.
Our work can support executives, finance teams, marketing leaders, sales organizations, operations managers, product teams, supply-chain professionals, customer-service departments, and boards. The goal is not to produce complicated analysis for its own sake. The goal is to improve the quality, speed, consistency, and accountability of important decisions.
At-a-Glance Data Science and Analytics Framework
| Analytics stage | What we deliver | Key technical signals | Decision outcome |
|---|---|---|---|
| Descriptive | KPI reporting, dashboards, data summaries | Revenue, cost, volume, conversion, variance | Understand what happened |
| Diagnostic | Segmentation, drivers, root-cause analysis | Correlation, cohorts, contribution, anomalies | Understand why it happened |
| Predictive | Forecasts, propensity, risk, demand models | Accuracy, confidence, lift, error | Anticipate what may happen |
| Prescriptive | Scenarios, optimization, recommendations | Constraint, sensitivity, expected value | Decide what to do next |
| Operational | Alerts, workflows, decision tools | Freshness, latency, adoption, action rate | Make decisions consistently |
| Strategic | Planning models, unit economics, simulations | ROI, margin, capacity, risk | Allocate resources intelligently |
Illustrative Analytics Maturity Graph
This graph is an illustrative planning model, not a guarantee. Actual progress depends on data quality, systems, governance, skills, implementation, and leadership adoption.
textIllustrative decision intelligence maturity

100 |                                      ███████████████████████  Prescriptive scale
 85 |                                ███████████████████           Predictive planning
 70 |                          █████████████████                   Trusted dashboards
 55 |                    ███████████████                           Data integration
 40 |              ███████████                                     KPI definition
 25 |        ██████                                                Data assessment
 10 |  ███                                                         Fragmented reporting
     +-------------------------------------------------------------------
       Month 1       Month 3       Month 6       Month 9       Month 12
Analytics maturity is cumulative. A reliable decision model depends on clear metrics, consistent data, appropriate analysis, user adoption, and an operating process that turns insight into action.
The Data-to-Decision Journey
textBusiness question and decision owner
                    ↓
Metric definition, baseline, and success criteria
                    ↓
Data discovery, quality assessment, and integration
                    ↓
Exploratory analysis, segmentation, and root cause
                    ↓
Forecast, prediction, scenario, or optimization model
                    ↓
Dashboard, alert, recommendation, or decision workflow
                    ↓
Action, measurement, feedback, and model improvement
What Are Data Science Services for Business Analytics?
Data science services for business analytics combine statistical analysis, machine learning, data engineering, visualization, experimentation, forecasting, and domain expertise to help organizations make evidence-based decisions.
Services may include:
- Business intelligence and KPI dashboards.
- Data strategy and analytics roadmaps.
- Data discovery and quality assessment.
- Data warehouse and lakehouse planning.
- Data integration and transformation.
- Exploratory data analysis.
- Descriptive and diagnostic analytics.
- Customer and product segmentation.
- Forecasting and scenario planning.
- Demand and capacity modeling.
- Customer lifetime value analysis.
- Churn and retention modeling.
- Lead scoring and propensity models.
- Pricing and promotion analytics.
- Marketing attribution and media measurement.
- Sales pipeline and revenue analytics.
- Fraud, risk, and anomaly detection.
- Inventory and supply-chain analytics.
- Experimentation and A/B testing.
- Prescriptive recommendations and optimization.
- Data visualization and executive reporting.
- Model deployment, monitoring, and governance.
- Analytics training and decision-process design.
The right service depends on the decision, not the fashionable technique. A clean KPI definition may create more value than a complex machine-learning model. A simple forecast may be more useful than an opaque prediction if managers need to understand assumptions and change the inputs.
Why Organizations Need Decision-Focused Data Science
Many organizations have reports but still struggle to make decisions. Reports may use inconsistent definitions, lag behind operations, focus on activity rather than outcomes, or fail to explain the action required. Teams may debate numbers instead of discussing the decision.
Decision-focused analytics begins by identifying:
- The decision being made.
- The person or team responsible.
- The time horizon.
- The available choices.
- The constraints.
- The cost of being wrong.
- The data required.
- The action that will follow the analysis.
- The metric that will indicate success.
For example, “What was last month’s revenue?” is a reporting question. “Which customer segments should receive additional retention investment next month?” is a decision question. The second question may require cohort analysis, customer value, churn probability, margin, service cost, and an intervention plan.
Unified Management Consulting connects analytical work with management action. We help leaders understand not only what the data says, but what the organization should consider doing next.
Our Data Science and Business Analytics Process
1. Business Question and Decision Discovery
We begin with stakeholder interviews, process mapping, existing reports, system review, and decision workshops. We clarify the business question and identify the decision owner.
Questions may include:
- What decision is currently difficult or delayed?
- What information is used today?
- Which metrics are trusted or disputed?
- What action will follow a better insight?
- What constraints affect the decision?
- How frequently does the decision occur?
- What is the cost of delay or error?
- Which teams need to collaborate?
- What would success look like in 30, 90, or 365 days?
The output is a decision brief with objectives, users, metrics, data sources, assumptions, risks, and acceptance criteria.
2. Data Inventory and Readiness Assessment
We review the data environment, including databases, spreadsheets, APIs, CRM, ERP, finance, marketing, product, customer-service, operational, sensor, survey, and external data.
The assessment examines:
- Data ownership and access.
- Table and field definitions.
- Source systems and lineage.
- Completeness and missing values.
- Duplicate records.
- Outliers and inconsistent formats.
- Time zones and date logic.
- Historical coverage.
- Update frequency.
- Identity resolution.
- Privacy and sensitivity.
- Label availability.
- Data contracts and schema changes.
- Reconciliation with finance or operational records.
Data quality is not a one-time technical inspection. It is a business concept. A field may be statistically complete but operationally misleading if the definition changed or if different teams enter it differently.
3. KPI and Metric Governance
A reliable analytics program needs a shared metric language. We define metrics with business meaning, formula, source, grain, filters, owner, refresh rate, and known limitations.
KPI Definition Table
| Metric | Business definition | Common risk | Recommended control |
|---|---|---|---|
| Revenue | Recognized sales under an agreed accounting definition | Orders, refunds, tax, and timing mixed together | Reconcile with finance |
| Customer acquisition cost | Acquisition spend divided by agreed new customers | Leads counted as customers | Connect CRM and finance |
| Conversion rate | Defined completed action divided by defined opportunity | Different denominator by team | Publish formula and scope |
| Churn rate | Customers or revenue lost under a defined period | Cancellation and inactivity confused | Define cohort and window |
| Gross margin | Revenue less relevant direct costs | Costs excluded inconsistently | Finance-approved calculation |
| Forecast accuracy | Error between forecast and actual | Different horizons or baselines | Track MAPE, WAPE, or bias |
We create a metric catalogue or semantic layer where useful. This reduces the risk that dashboards show different values for the same business term.
4. Data Modeling and Engineering
We design data pipelines and analytical models that make trusted information available at the required frequency. Services may include:
- Source extraction.
- API and database integration.
- Batch and streaming ingestion.
- Data cleaning and normalization.
- Identity resolution.
- Slowly changing dimensions.
- Fact and dimension modeling.
- Star schemas.
- Data marts.
- Lakehouse or warehouse architecture.
- Transformation pipelines.
- Data validation.
- Incremental processing.
- Historical backfills.
- Lineage and documentation.
- Access and retention controls.
Engineering choices depend on data volume, freshness, latency, cost, tools, team capability, and decision requirements. A daily decision does not always need real-time architecture. A fraud or operational alert may require low-latency processing.
5. Exploratory and Diagnostic Analysis
Exploratory analysis helps reveal distributions, trends, segments, relationships, anomalies, and data limitations. Diagnostic analysis investigates why a metric changed or why outcomes differ across customer, product, location, channel, or operational groups.
We may use:
- Cohort analysis.
- Funnel analysis.
- Contribution analysis.
- Variance analysis.
- Segmentation.
- Correlation and regression.
- Pareto analysis.
- Root-cause trees.
- Geographic analysis.
- Time-series decomposition.
- Anomaly detection.
- Survival and retention analysis.
Correlation does not prove causation. We distinguish descriptive relationships from causal evidence and recommend experiments or additional analysis where a decision depends on causality.
Predictive Analytics and Machine Learning
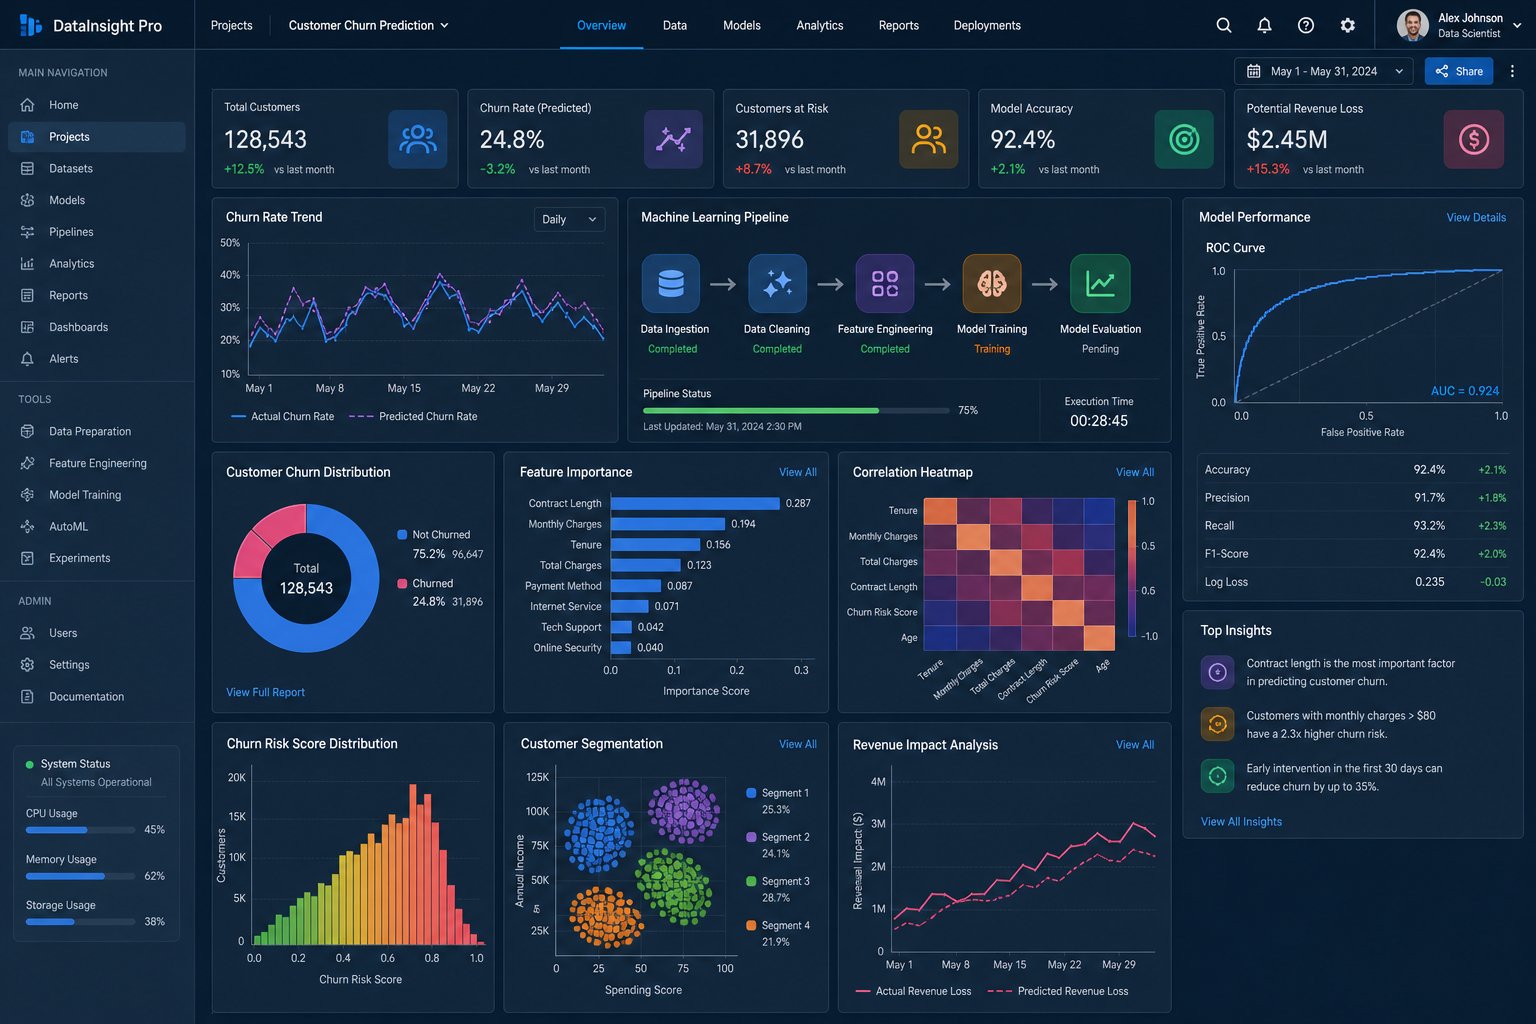
Predictive models estimate an outcome using historical and current data. Examples include demand forecasts, churn risk, lead conversion, customer value, fraud risk, inventory needs, ticket classification, payment default, and maintenance risk.
A predictive analytics project includes:
- Target definition.
- Observation and prediction windows.
- Feature design.
- Training and validation split.
- Leakage controls.
- Baseline model.
- Candidate algorithms.
- Hyperparameter strategy.
- Calibration.
- Threshold selection.
- Fairness and bias review.
- Error analysis.
- Deployment plan.
- Monitoring and retraining.
Model Evaluation Table
| Model use case | Important metrics | Business interpretation |
|---|---|---|
| Classification | Precision, recall, F1, ROC-AUC, PR-AUC | How reliably does the model identify cases? |
| Forecasting | MAE, RMSE, MAPE, WAPE, bias | How close are estimates to actual demand? |
| Ranking | NDCG, MAP, hit rate | Are useful items ranked near the top? |
| Regression | MAE, RMSE, R², calibration | How close are numeric predictions? |
| Churn | Lift, recall at capacity, calibration | Can retention teams target useful customers? |
| Anomaly detection | Precision, alert rate, detection delay | Are alerts actionable or noisy? |
A model metric should be connected to operational capacity. A retention model with high recall may identify many customers, but the business may only have resources to contact a limited number. Thresholds should reflect the available intervention and the value of being correct.
Forecasting and Scenario Planning
Forecasting supports decisions about demand, revenue, staffing, inventory, capacity, cash flow, customer support, and marketing. We evaluate historical patterns, seasonality, promotions, holidays, pricing, external drivers, structural breaks, and known future events.
Forecasting services may include:
- Revenue forecasting.
- Sales pipeline forecasting.
- Demand forecasting.
- Inventory requirements.
- Workforce and staffing.
- Customer-support volume.
- Cash-flow scenarios.
- Marketing response.
- Subscription and retention.
- Capacity planning.
We may provide a base forecast, upside and downside scenarios, confidence intervals, assumptions, and sensitivity analysis. Decision-makers should know what could cause the forecast to change.
Illustrative Forecast Table
| Scenario | Demand assumption | Capacity implication | Decision use |
|---|---|---|---|
| Base case | Expected trend and known seasonality | Normal staffing and inventory | Operating plan |
| Upside | Higher conversion or demand | Additional capacity required | Prepare resources |
| Downside | Lower demand or disruption | Cost-control and contingency plan | Protect cash and service |
| Promotion | Temporary demand increase | Stock, staffing, and support planning | Evaluate campaign economics |
| Stress case | Extreme but plausible event | Resilience and risk response | Executive risk planning |
Prescriptive Analytics and Optimization
Prescriptive analytics helps evaluate possible actions under constraints. Examples include:
- Which customers should receive an offer?
- How should inventory be allocated?
- Which sales opportunities should receive attention?
- What price or promotion should be tested?
- How should staff or delivery capacity be assigned?
- Which marketing budget allocation is most efficient?
- Which routes or schedules minimize cost?
We may use scenario models, linear programming, integer optimization, simulation, decision trees, or rules combined with predictive models. The objective is not to make a recommendation without explanation. It is to expose trade-offs, constraints, expected value, and sensitivity.
Decision Model Structure
textInputs and assumptions
          ↓
Demand, cost, risk, and capacity estimates
          ↓
Constraints and business rules
          ↓
Scenario or optimization model
          ↓
Recommended actions and alternatives
          ↓
Approval, execution, and outcome measurement
Dashboards and Decision Intelligence
A dashboard should answer a management question. It should not simply display every available metric. We design dashboards for specific users and decision rhythms.
Executive dashboards may include:
- Revenue and margin.
- Growth and variance.
- Cash and pipeline.
- Customer acquisition and retention.
- Major risks and opportunities.
- Forecast versus actual.
- Recommended decisions.
Operational dashboards may include:
- Queue and workload.
- Service levels.
- Inventory and capacity.
- Campaign and sales activity.
- Exceptions and alerts.
- Daily or hourly performance.
Analytical dashboards may include:
- Segments and cohorts.
- Drivers and root causes.
- Model scores.
- Forecast ranges.
- Experiment results.
- Drill-down analysis.
We consider layout, hierarchy, filters, definitions, accessibility, mobile use, performance, refresh time, permissions, annotations, and action links. A useful dashboard makes the next question easier to answer.
Experimentation and Causal Decision-Making
When an organization wants to know whether an action caused an outcome, descriptive analytics may not be enough. We design experiments and quasi-experimental analyses where appropriate.
Experimentation services may include:
- A/B tests.
- Holdout groups.
- Randomized trials.
- Geo experiments.
- Pre/post analysis with controls.
- Difference-in-differences.
- Incrementality testing.
- Sequential testing.
- Power and sample-size planning.
- Guardrail metrics.
- Heterogeneous treatment effects.
A valid experiment requires a clear treatment, control, outcome, observation window, randomization or credible design, and analysis plan. We also consider operational interference, seasonality, novelty effects, sample size, and ethical constraints.
Customer and Marketing Analytics
Data science can improve customer acquisition, conversion, retention, and lifetime value. Services may include:
- Customer segmentation.
- Customer lifetime value.
- Churn prediction.
- Retention cohorts.
- Lead scoring.
- Marketing attribution.
- Campaign incrementality.
- Product recommendation.
- Next-best action.
- Cross-sell and upsell.
- Customer journey analysis.
- Voice-of-customer analysis.
- Sentiment and topic analysis.
Attribution should be interpreted carefully. Last-click reporting can undervalue awareness, while platform-reported conversions can overstate influence if definitions differ. We compare systems, document assumptions, and use experiments where the decision requires incremental evidence.
Financial, Operational, and Supply-Chain Analytics
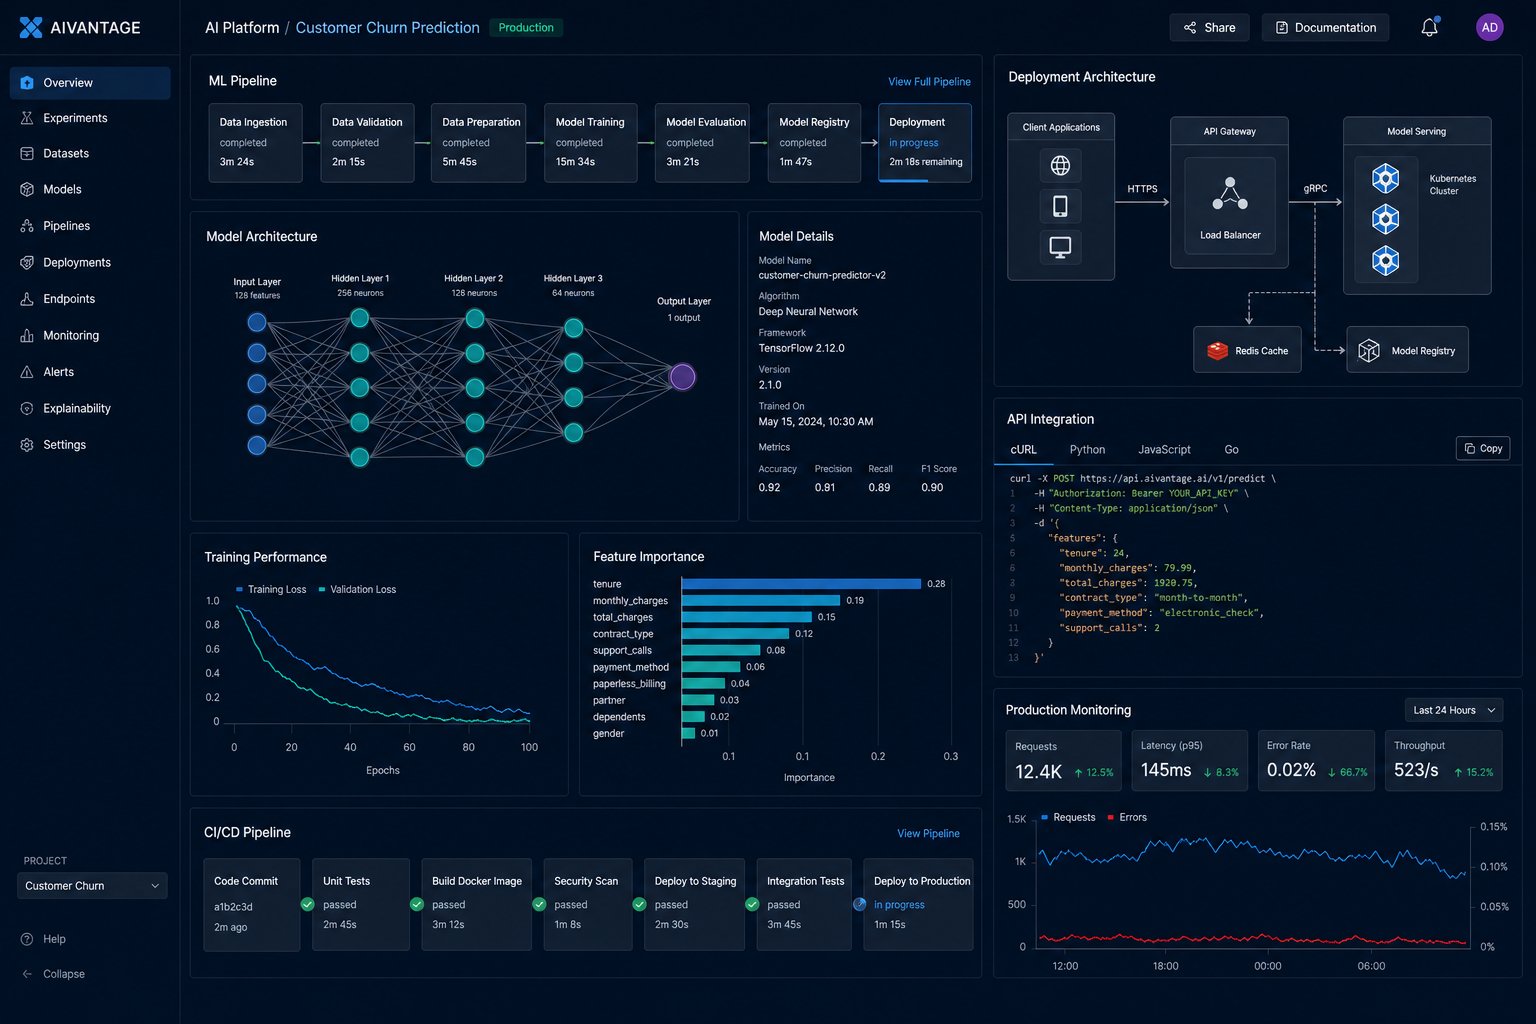
For finance and operations, analytics can support planning, performance management, risk control, and resource allocation.
Potential services include:
- Budget and variance analysis.
- Profitability by customer, product, or location.
- Cash-flow forecasting.
- Procurement analytics.
- Supplier performance.
- Inventory optimization.
- Demand and capacity planning.
- Delivery and route analysis.
- Workforce scheduling.
- Quality and defect analysis.
- Maintenance prediction.
- Fraud and anomaly detection.
These models need operational definitions and feedback. A forecast should be evaluated after actual outcomes occur. An alert should be judged by whether a person can act on it and whether the intervention improves the result.
Data Governance, Privacy, and Responsible Analytics
Business analytics involves customer, employee, financial, operational, and potentially sensitive data. We design data practices around purpose, access, quality, retention, transparency, and accountability.
Controls may include:
- Data classification.
- Role-based access.
- Row- and column-level security.
- Encryption.
- Pseudonymization and masking.
- Consent and purpose limitation.
- Retention and deletion.
- Data lineage.
- Model documentation.
- Bias and fairness review.
- Human review for high-impact decisions.
- Audit trails.
- Vendor and platform assessment.
- Incident response.
A model should not be used for a high-impact decision without appropriate validation, oversight, explanation, and appeal or review processes. We help organizations define where automation is acceptable and where human judgment must remain central.
Deployment, Monitoring, and Model Operations
An analysis is only useful if it can be maintained. Production analytics and models require repeatable pipelines, version control, tests, monitoring, documentation, and ownership.
Data science deployment services may include:
- Data and model versioning.
- Reproducible notebooks and pipelines.
- CI/CD for analytical code.
- Feature pipelines.
- Batch or real-time scoring.
- API services.
- Dashboard deployment.
- Model registry.
- Drift monitoring.
- Data-quality alerts.
- Performance and latency monitoring.
- Retraining schedules.
- Threshold review.
- Rollback and fallback logic.
- Cost and resource monitoring.
We monitor data drift, concept drift, missing values, changing category distributions, model calibration, prediction volume, alert rates, business outcomes, and user feedback. A model that remains technically online but loses business accuracy is not healthy.
Data Science Services for Different Business Models
B2B and Professional Services
Analytics can support pipeline forecasting, account prioritization, lead scoring, proposal analysis, client profitability, utilization, resource planning, and customer retention. CRM quality and sales-stage definitions are essential.
Ecommerce and Retail
Data science can improve demand forecasting, product recommendations, pricing, promotion, inventory, customer lifetime value, churn, return prediction, and marketing efficiency. Margin and stock constraints should be included in decisions.
SaaS and Technology
SaaS analytics may focus on activation, feature adoption, retention, expansion, churn, usage, customer health, support, and revenue forecasting. Product events must be consistently defined and connected to account and billing data.
Finance and Risk
Financial analytics may support forecasting, fraud detection, credit risk, anomaly detection, profitability, collections, and scenario planning. Governance, explainability, privacy, and review processes are critical.
Manufacturing and Operations
Analytics can support quality, maintenance, production, supply chain, workforce, inventory, and capacity. Sensor and operational data require reliable timestamp, asset, and event definitions.
Healthcare and Sensitive Services
Analytics can support scheduling, service operations, capacity, outcomes, and resource allocation. Sensitive data requires strict governance, privacy, expert review, and appropriate limitations.
Why Choose Unified Management Consulting?
Data Science and Business Strategy Together
We connect analysis with decision ownership, operating processes, financial value, customer impact, and implementation. Technical sophistication is balanced with practical usefulness.
Clear Definitions and Trusted Metrics
We help teams agree on metric definitions, data sources, formulas, owners, refresh rates, and limitations so management discussions focus on decisions rather than conflicting numbers.
Practical Modeling
We use the simplest analytical approach that meets the decision requirement. A transparent forecast or scoring model may be more useful than a complex model that users cannot trust or operate.
From Analysis to Action
We build dashboards, alerts, recommendations, workflows, and operating routines that help teams act on insights.
Responsible and Governed Analytics
Privacy, access, fairness, quality, monitoring, documentation, and human oversight are included in the analytics lifecycle.
Management Consulting Perspective
Data does not make decisions by itself. People, incentives, processes, capacity, and accountability determine whether insights create results. Our consulting approach helps organizations design the management system around analytics.
Data Science Services Pricing
Fees depend on the number and complexity of data sources, data quality, warehouse or lakehouse requirements, model type, reporting scope, integration needs, deployment environment, governance, number of users, and level of ongoing support.
Before selecting a provider, clarify whether the engagement includes:
- Business question and decision discovery.
- Data inventory and readiness assessment.
- KPI and metric governance.
- Data integration and transformation.
- Warehouse, lakehouse, or data-mart design.
- Exploratory and diagnostic analysis.
- Forecasting and scenario planning.
- Machine-learning models.
- Segmentation, churn, propensity, or scoring.
- Optimization and prescriptive analytics.
- Dashboard and visualization design.
- Experimentation and causal analysis.
- Model deployment and monitoring.
- Data governance and privacy design.
- Training, documentation, and knowledge transfer.
- Ongoing analytics support.
Cloud, software, data providers, specialized audits, implementation engineering, and ongoing monitoring may be separate costs. Ownership of data models, pipelines, code, dashboards, model artifacts, documentation, and access should be clearly defined.
How Analytics Performance Is Evaluated
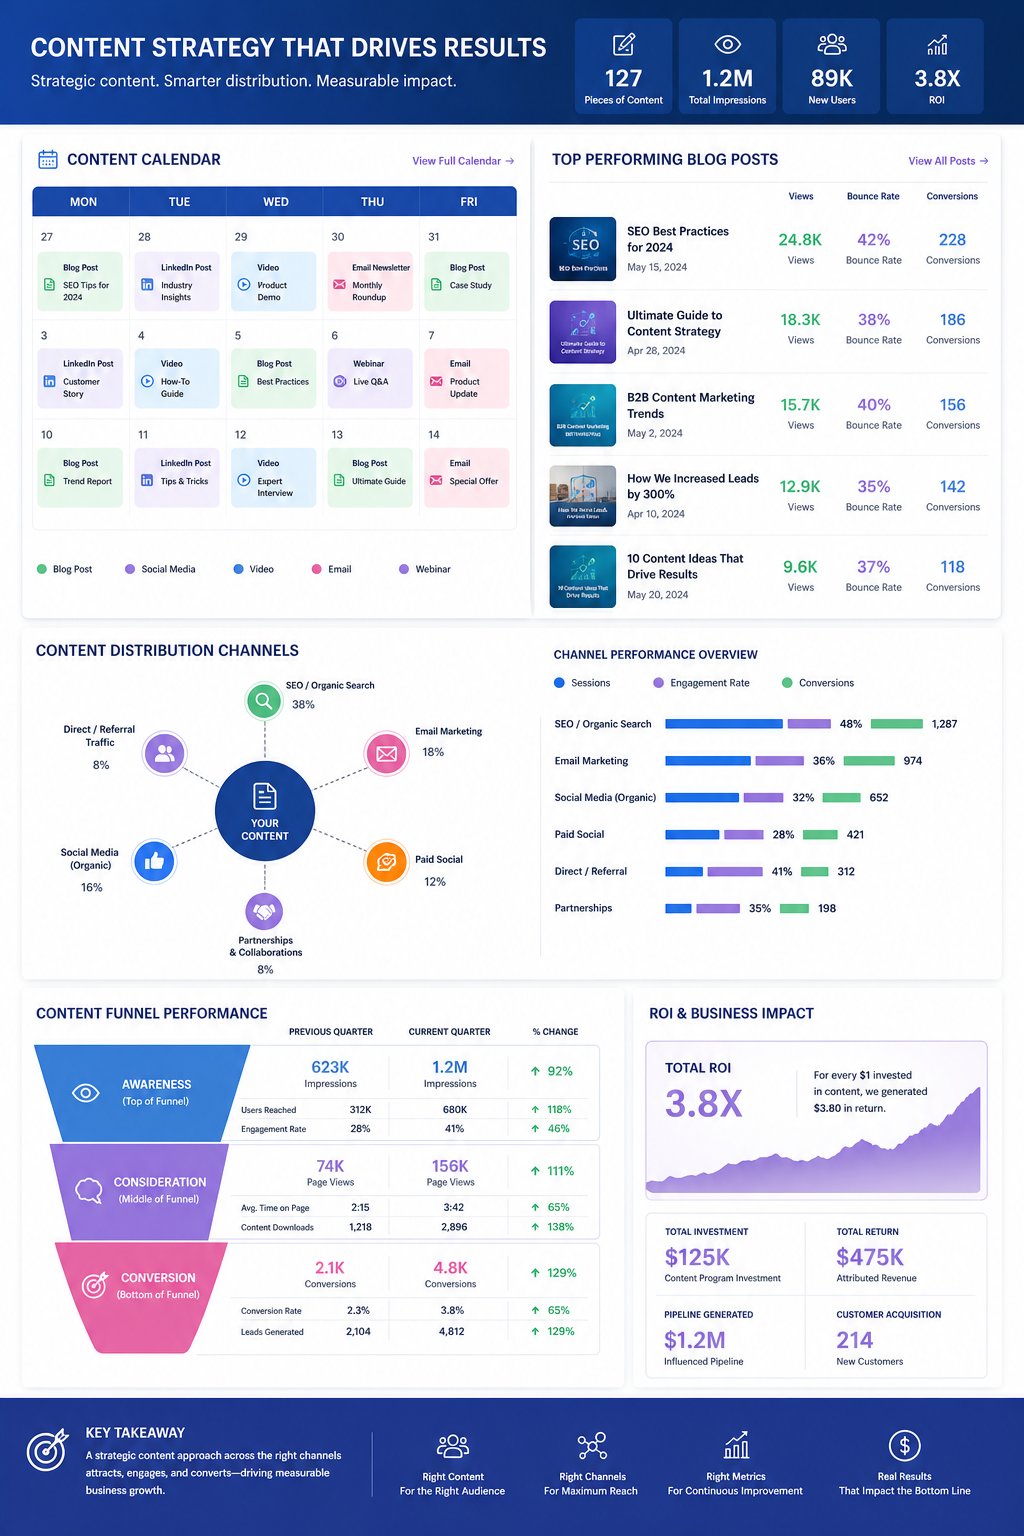
No responsible provider can guarantee a fixed revenue increase, cost saving, forecast accuracy, or model outcome without controlling the data, decision process, market, implementation, and adoption.
Early work may focus on defining the decision, establishing a baseline, resolving data quality issues, and producing a useful analytical view. Later evaluation can include forecast error, model lift, adoption, time saved, decision speed, conversion, retention, margin, cost reduction, risk reduction, and revenue.
A dashboard with many users is not necessarily valuable if it does not change decisions. A model with strong validation metrics may not create value if the business cannot act on the prediction. We connect analytics metrics with operational and financial outcomes.
Technical Audit Checklist
Before investing in a large data science and analytics program, we assess:
- Whether each analytics project has a clear decision owner and business question.
- Whether metrics have approved definitions and sources.
- Whether data is accessible, complete, accurate, timely, and authorized.
- Whether customer, product, account, and transaction identities can be joined reliably.
- Whether data lineage, schemas, and ownership are documented.
- Whether the analysis distinguishes correlation from causation.
- Whether models use appropriate baselines and validation designs.
- Whether leakage, bias, drift, and unfair outcomes are tested.
- Whether dashboards are designed for specific users and decisions.
- Whether recommendations account for constraints and operational capacity.
- Whether data pipelines have tests, monitoring, retries, and reconciliation.
- Whether models and analytical code are versioned and reproducible.
- Whether privacy, access, retention, and security controls are adequate.
- Whether production models have alerts, retraining, and rollback processes.
- Whether analytics are connected to CRM, finance, ecommerce, and operations.
- Whether teams are trained to interpret and act on insights.
- Whether results are measured after actions are taken.
Frequently Asked Questions About Data Science Services
What are data science services for business?
They are analytical, statistical, engineering, modeling, visualization, and consulting services that help organizations understand performance, predict outcomes, evaluate choices, and make better business decisions.
What is the difference between business intelligence and data science?
Business intelligence often focuses on reporting what happened and monitoring current performance. Data science can add diagnostic analysis, prediction, experimentation, optimization, and machine learning. The two disciplines work best together.
Do we need a data warehouse before starting?
Not always. A focused analytics project can begin with available sources, but a warehouse or data model may become necessary for scale, consistency, history, governance, and multiple users. We recommend architecture based on decision requirements rather than assuming one starting point.
Can you build executive dashboards?
Yes. We design dashboards around executive questions, KPI definitions, trends, variance, forecasts, risks, opportunities, and recommended decisions. We can also develop operational and analytical views for teams.
Can you forecast revenue and demand?
Yes. Forecasting can support revenue, sales pipeline, inventory, staffing, support volume, cash flow, and capacity. We include assumptions, scenarios, confidence ranges, accuracy monitoring, and updates as new information arrives.
Can data science improve marketing and sales?
Yes. Services may include segmentation, lead scoring, customer lifetime value, attribution, propensity, churn, campaign analysis, conversion modeling, and next-best-action recommendations. CRM data quality and outcome feedback are important.
How do you protect business and customer data?
We assess data classification, access, encryption, masking, pseudonymization, retention, consent, vendor risk, audit logs, and human review. Controls depend on the data, industry, jurisdictions, and use case.
Can you guarantee model accuracy?
No. Accuracy depends on the data, task, time period, labels, operating environment, and acceptable error definition. We establish baselines, test representative cases, monitor drift, document limitations, and connect model quality to business outcomes.
What happens after a model is deployed?
Production models require monitoring, data-quality checks, drift analysis, retraining or recalibration, version control, threshold review, incident response, and stakeholder feedback. We can provide ongoing support or transfer ownership to your team.
Do you help with data strategy and training?
Yes. We can create analytics roadmaps, metric catalogues, governance processes, documentation, stakeholder training, data-literacy programs, and decision routines so the organization can use analytics consistently.
Build a More Intelligent Decision System
Data science creates value when reliable information is connected to a real decision, an accountable owner, an appropriate analytical method, a usable output, and a process for measuring what happens next.
Unified Management Consulting helps organizations build this connection. Our data science services for business analytics and decision-making combine data engineering, statistics, machine learning, forecasting, visualization, experimentation, governance, and management consulting.
Contact Unified Management Consulting for a data-readiness assessment, KPI and dashboard review, forecasting project, predictive model, analytics roadmap, or customized decision-intelligence engagement.
Suggested SEO Metadata
SEO title: Data Science Services for Business Analytics | Unified Management Consulting
Meta description: Improve business decisions with data science services covering analytics, dashboards, forecasting, machine learning, customer insights, optimization, data engineering, and governance.
Suggested URL slug: /data-science-business-analytics-services/
Primary keyword: data science services for business analytics
Secondary keywords: business analytics services, data science consulting, decision intelligence, predictive analytics services, business intelligence consulting, forecasting services, machine learning consulting, data analytics company, KPI dashboard services, data-driven decision-making
Suggested Calls to Action
- Request a data-readiness assessment
- Build a trusted KPI and analytics dashboard
- Improve forecasting and scenario planning
- Develop a predictive business model
- Connect analytics to revenue and decisions
- Create a data science roadmap
- Schedule a business analytics consultation