
Chart values are an illustrative planning model based on typical UMC engagements and published industry benchmarks. They are not a guarantee of results on any specific project.
Most AI programmes fail their ROI test not because the model is weak, but because nobody agreed in advance what success would be measured in, who owns the number, and what the baseline was before the system went live. A model that saves eleven minutes a task is worth nothing to a board that cannot see which eleven minutes, in which process, verified by whom.
AI ROI measurement is the discipline of turning AI spend into numbers an executive team can act on. It is not a dashboard exercise. It starts before any build: agreeing the baseline, choosing metrics that a process owner will defend, instrumenting the data needed to compute them, and publishing a scorecard that survives scrutiny from finance, audit and the people whose work is being measured. Unified Management Consulting builds that measurement layer as a delivered service, not a template handed over on day one and forgotten.
💰 AI ROI Measurement & Executive Scorecards — Quick Summary
| Component | What We Deliver |
|---|---|
| Baseline capture | Measured pre-AI performance on cycle time, error rate, cost per transaction, and throughput for every process the AI touches — documented before go-live so later gains are attributable. |
| Benefit model | Bottom-up value calculation per use case, with adoption curves, run-rate cost, supervision overhead and a stalled-adoption scenario shown alongside the base case. |
| Executive scorecard | One page, refreshed on a fixed cadence, carrying cost, quality, adoption, risk and outcome metrics — with an owner named against each number. |
| Instrumentation | Event logging, token and cost telemetry, human-review capture and quality sampling wired into the production system so the scorecard computes itself. |
| Verification & audit trail | Independent check of reported gains against source records, with the calculation method written down so finance can reproduce it. |
| Decision support | Scale / hold / retire recommendation per use case at each gate, with the evidence attached. |
The service pairs naturally with AI Readiness Assessment & Roadmap, which sets the priorities, and with AI Governance, Risk & Compliance Services, which supplies the risk column of the scorecard. For background on the framework itself see our practitioner guide Measuring AI ROI: Building an Executive Scorecard.
Why AI ROI Measurement Keeps Failing
Conventional capital appraisal assumes a system does one defined job at a known cost. AI breaks all three assumptions. Output quality varies by input, so a single average hides a long tail of failures that still consume effort. Cost varies with volume, context length and model choice, so the run-rate is a moving number rather than a licence fee. And the benefit usually lands in someone’s working day as reclaimed time, which only becomes real money if that time is redeployed or the headcount plan changes.
The result is a familiar pattern. A pilot is declared successful on anecdote and a demo. A business case is written promising a percentage saving. Six months later nobody can produce the baseline that percentage was measured against, finance cannot reconcile AI spend to a cost centre, and the programme is either frozen or quietly expanded without evidence in either direction. Our analysis of AI agent ROI realities documents how often the production economics diverge from the pilot economics, and the divergence is almost always a measurement failure rather than a technology failure.
| Failure mode | What it looks like | What fixes it |
|---|---|---|
| No defensible baseline | Gains quoted as a percentage with no pre-AI figure on record | Instrument the process and record baseline for a full cycle before go-live |
| Benefit claimed twice | The same reclaimed hour counted by two departments | Single benefit register with one owner per line and an explicit attribution rule |
| Cost shown at licence price only | Inference, supervision, rework and retraining omitted | Full cost model including run-rate per transaction and human-review time |
| Adoption assumed at 100% | Business case modelled on every user, every task, from day one | Ramp curve by role with measured utilisation tracked on the scorecard |
| Demo metrics, not production metrics | Accuracy measured on a curated sample | Continuous quality sampling against live traffic with the sample size disclosed |
| No retirement path | Failing use cases kept alive for reputational reasons | Pre-agreed kill criteria at each gate, decided in advance |
The Measurement Stack: Four Layers You Need
A working AI ROI system has four layers. Skipping any one of them produces a scorecard that either cannot be computed or cannot be believed.
| Layer | What it captures | Typical instruments | Owner |
|---|---|---|---|
| 1. Activity | Every request, token count, model used, latency, outcome, and whether a human overrode it | Application event log, gateway telemetry, model provider usage API | Platform engineering |
| 2. Cost | Inference spend, storage, vector and retrieval cost, compute, licence, and internal supervision time | Cloud billing tags, usage export, timesheet or sampled time study | Finance with platform |
| 3. Quality | Correctness, groundedness, refusal behaviour, escalation rate, rework rate | Evaluation harness, sampled human review, customer complaint linkage | Process owner with QA |
| 4. Outcome | The business number that matters: cycle time, cost per transaction, conversion, throughput, defect rate | Existing operational systems — ERP, CRM, ticketing, WMS | Business unit |
Layer 4 is where boards look and layers 1 to 3 are where the evidence lives. The most common build mistake is wiring only layer 4 and then being unable to explain a variance. If cost-per-transaction rises in month seven, you need layer 1 and 2 to say whether it was volume, longer contexts, a model change or a drop in first-pass accuracy causing rework.
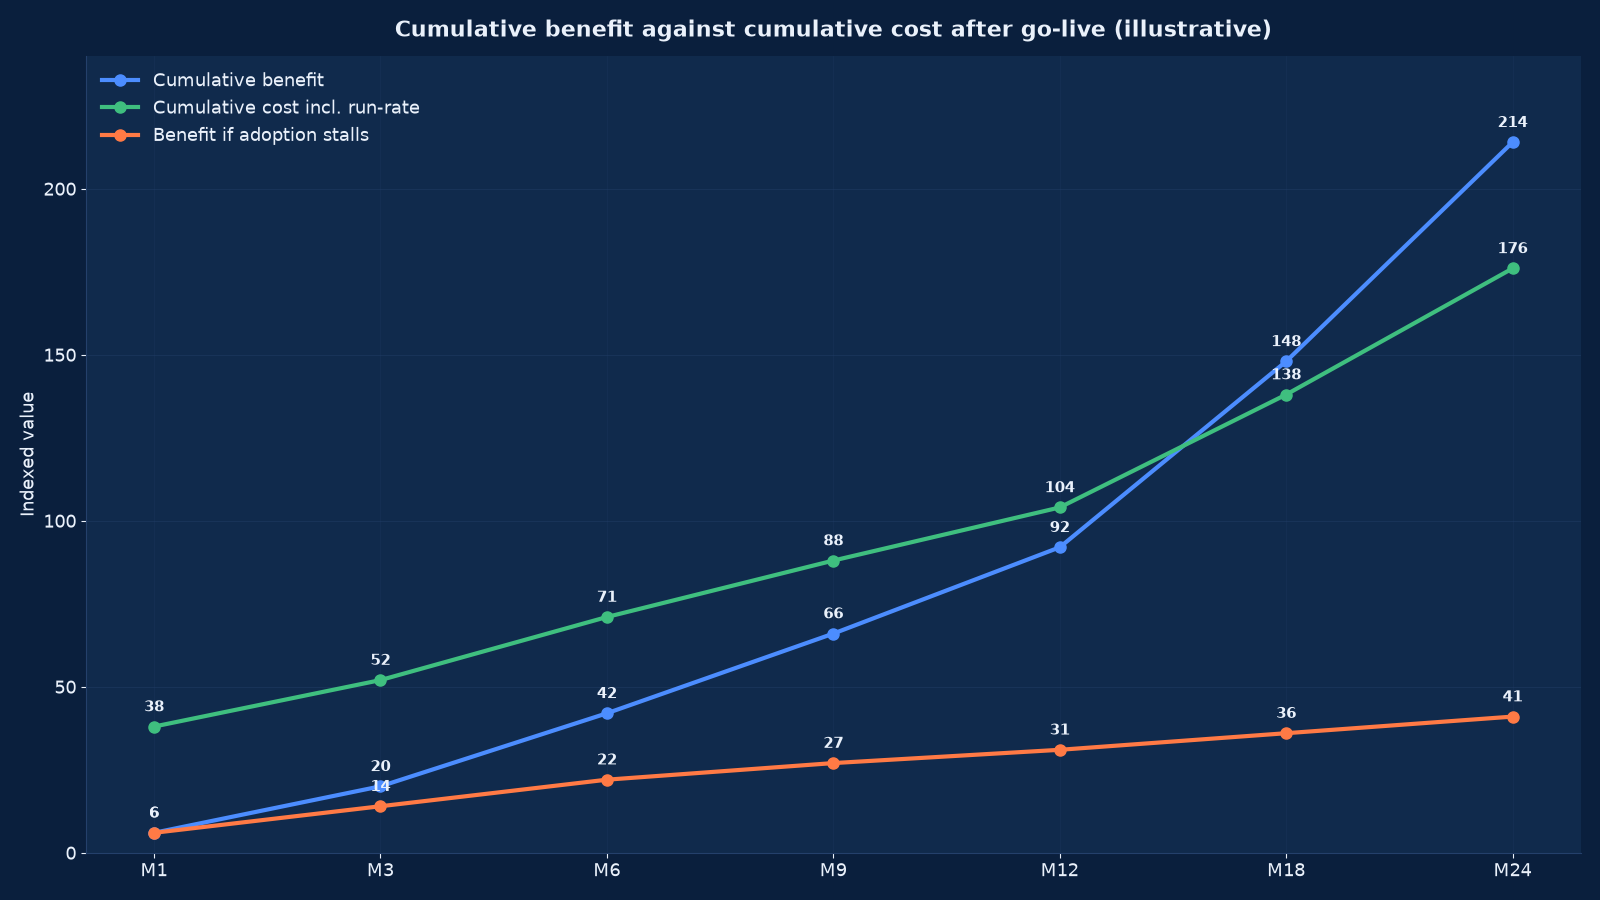
Chart values are an illustrative planning model based on typical UMC engagements and published industry benchmarks. They are not a guarantee of results on any specific project.
Building a Benefit Model That Survives Finance Review
Model bottom-up, never top-down. A top-down model starts with a target saving and works backwards to justify it; a bottom-up model starts with a task, counts how often it happens, measures how long it takes, and applies a defensible improvement rate. Finance will attack the improvement rate, so make it the smallest number that the pilot evidence actually supports and show the sensitivity.
The calculation per use case runs in five steps:
- Frequency. How many times per month does the task occur, and across how many people or systems? Take this from operational logs, not from an estimate.
- Current unit effort. Minutes per occurrence, including the review and correction time that everyone forgets to count. Where possible, time-study a sample rather than asking.
- Improvement rate. Percentage of that effort removed, net of new supervision effort introduced by the AI. If the AI output needs review, the net saving is the gross saving minus the review time.
- Adoption curve. What proportion of eligible occurrences will actually go through the AI in month 3, 6 and 12? Assume less than the vendor’s figure. Track it.
- Monetisation. Convert reclaimed effort at fully-loaded cost, and state clearly whether the benefit is realised as reduced headcount, avoided hiring, redeployed capacity or pure time that may never be captured. Only the first two are hard savings.
| Benefit type | Definition | Hard or soft | Evidence required |
|---|---|---|---|
| Cost avoided | An expense that no longer occurs | Hard | Invoice or ledger comparison |
| Headcount redeployed | People moved to other work at unchanged cost | Soft | Signed redeployment decision from the business unit |
| Capacity released | Same team handles more volume | Soft until volume rises | Throughput figures before and after |
| Error and rework reduction | Fewer corrections, refunds, disputes, escalations | Hard if tracked | Defect or dispute counts from the operational system |
| Revenue effect | Conversion, response rate, win rate, retention | Hard if attributable | Controlled comparison or holdout group |
| Cycle time | Faster order-to-cash, quote, or resolution | Hard | Timestamp deltas in the source system |
Never present a soft benefit as though it were hard. Boards forgive a modest number; they do not forgive a number that cannot be reproduced. The same rule applies to attribution: if you cannot separate the AI effect from a marketing campaign or a process change running in the same period, say so and show the confidence range.
Cost Categories Most Business Cases Miss
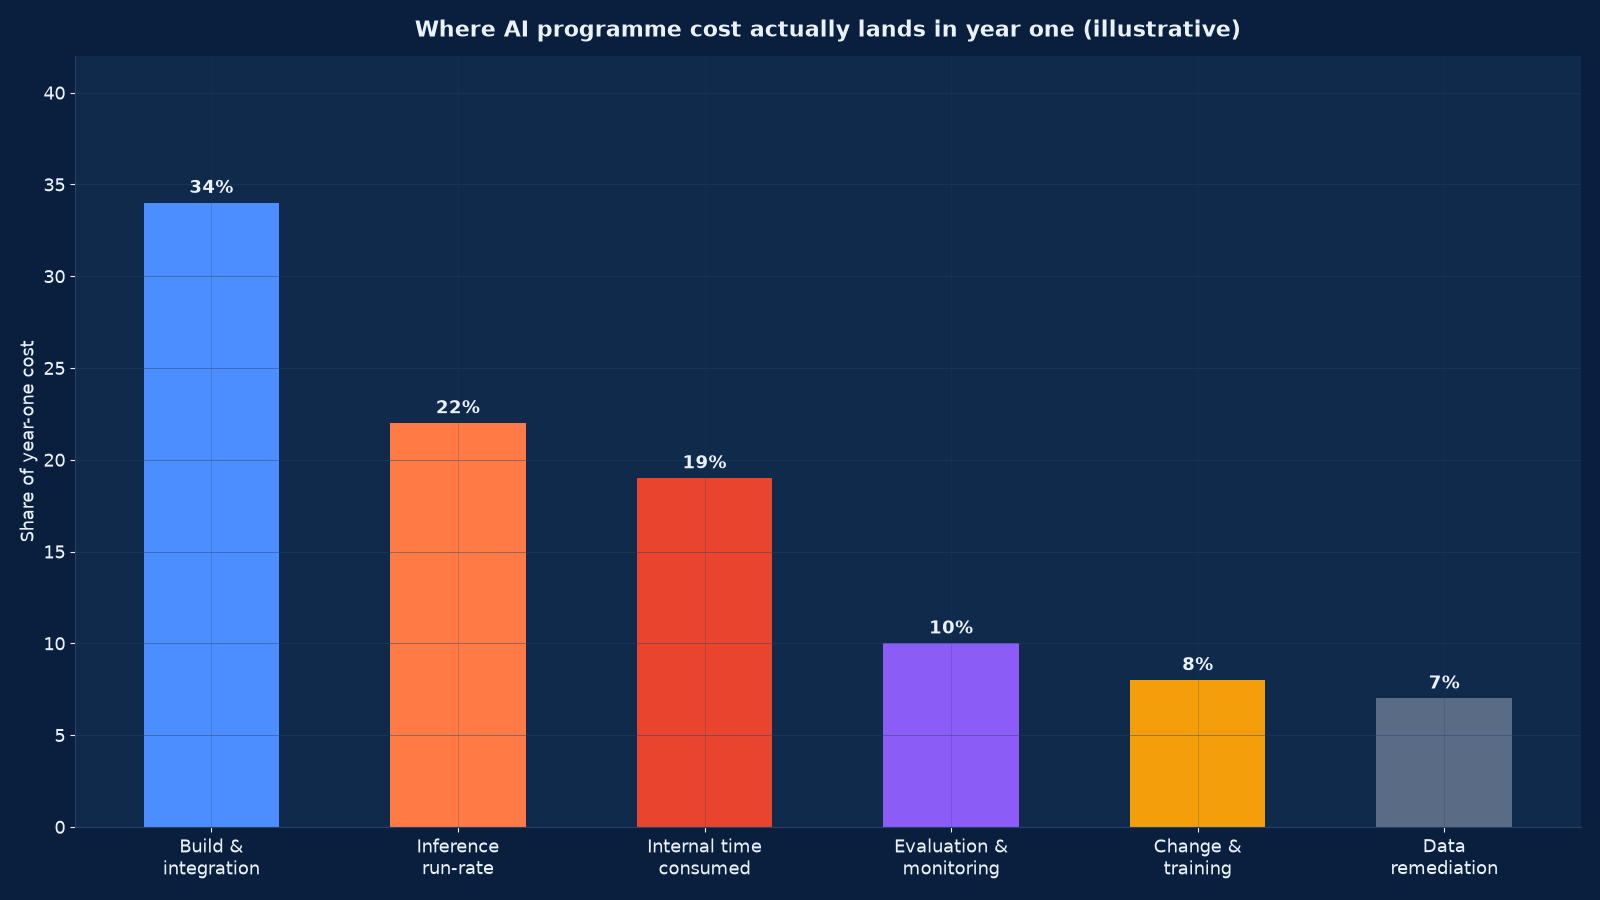
Build cost is the visible part. Figure 1 shows the realistic split, and the categories that surprise executives are the ones below the line.
| Cost category | Why it is missed | How to forecast it |
|---|---|---|
| Inference run-rate | Modelled once at pilot volume, then volume grows tenfold | Cost per transaction from the pilot, multiplied by a forecast volume curve with headroom |
| Context and retrieval overhead | Long documents and RAG multiply token counts | Measure average input tokens in the pilot, not the minimum case |
| Human supervision and review | Treated as free because it is existing staff time | Sample the review rate per 100 outputs and cost it at loaded rates |
| Rework from wrong answers | Only visible once users start correcting output | Track override and correction events from day one |
| Evaluation and regression testing | Seen as optional, then becomes mandatory after an incident | Budget a standing evaluation set and a run per model change |
| Model and vendor churn | Prices, versions and capabilities change quarterly | Re-baseline the cost model at each gate rather than annually |
| Data remediation | Surfaces when the AI is first pointed at real records | Assume a data cleaning workstream; see our Data Science & Business Analytics services for the delivery pattern |
| Change, training and adoption | Assumed to be a one-hour briefing | Plan a real enablement programme — see AI Agent Deployment & Automation |
Designing the Executive Scorecard
One page. Fixed cadence. Every number has a named owner, a definition and a source system. If a metric cannot be computed automatically from an instrumented source, it does not belong on the scorecard — it belongs in a quarterly review where a human can explain it.
| Scorecard section | Metrics | Cadence | Read by |
|---|---|---|---|
| Value | Net benefit to date, benefit run-rate, payback position, cost per transaction | Monthly | CEO, CFO |
| Delivery | Use cases live, in build, retired, on-time rate, defect escape rate | Monthly | COO, CTO |
| Adoption | Active users as % of eligible, tasks routed through AI, abandonment rate, time to first successful use | Monthly | Business unit heads |
| Quality | First-pass accuracy on sampled live traffic, override rate, groundedness score, escalation rate | Fortnightly | Process owners, QA |
| Cost | Run-rate by model and by use case, spend against forecast, unit economics trend | Monthly | CFO, platform lead |
| Risk | Open incidents, near misses, audit findings, model and vendor changes, policy exceptions | Monthly | CRO, compliance |
| Decision | Gate recommendations with evidence attached — scale, hold, retire | Quarterly | Steering group |
Keep the metric count deliberately low. A scorecard with thirty indicators is a report, and reports get skimmed. Ten to fourteen numbers, each with a trend arrow and a variance explanation, is what gets discussed. Figure 3 shows how unevenly organisations actually measure: adoption is usually tracked because it is easy, while revenue attribution is almost never tracked because it is hard — and it is precisely the number the board asks for.
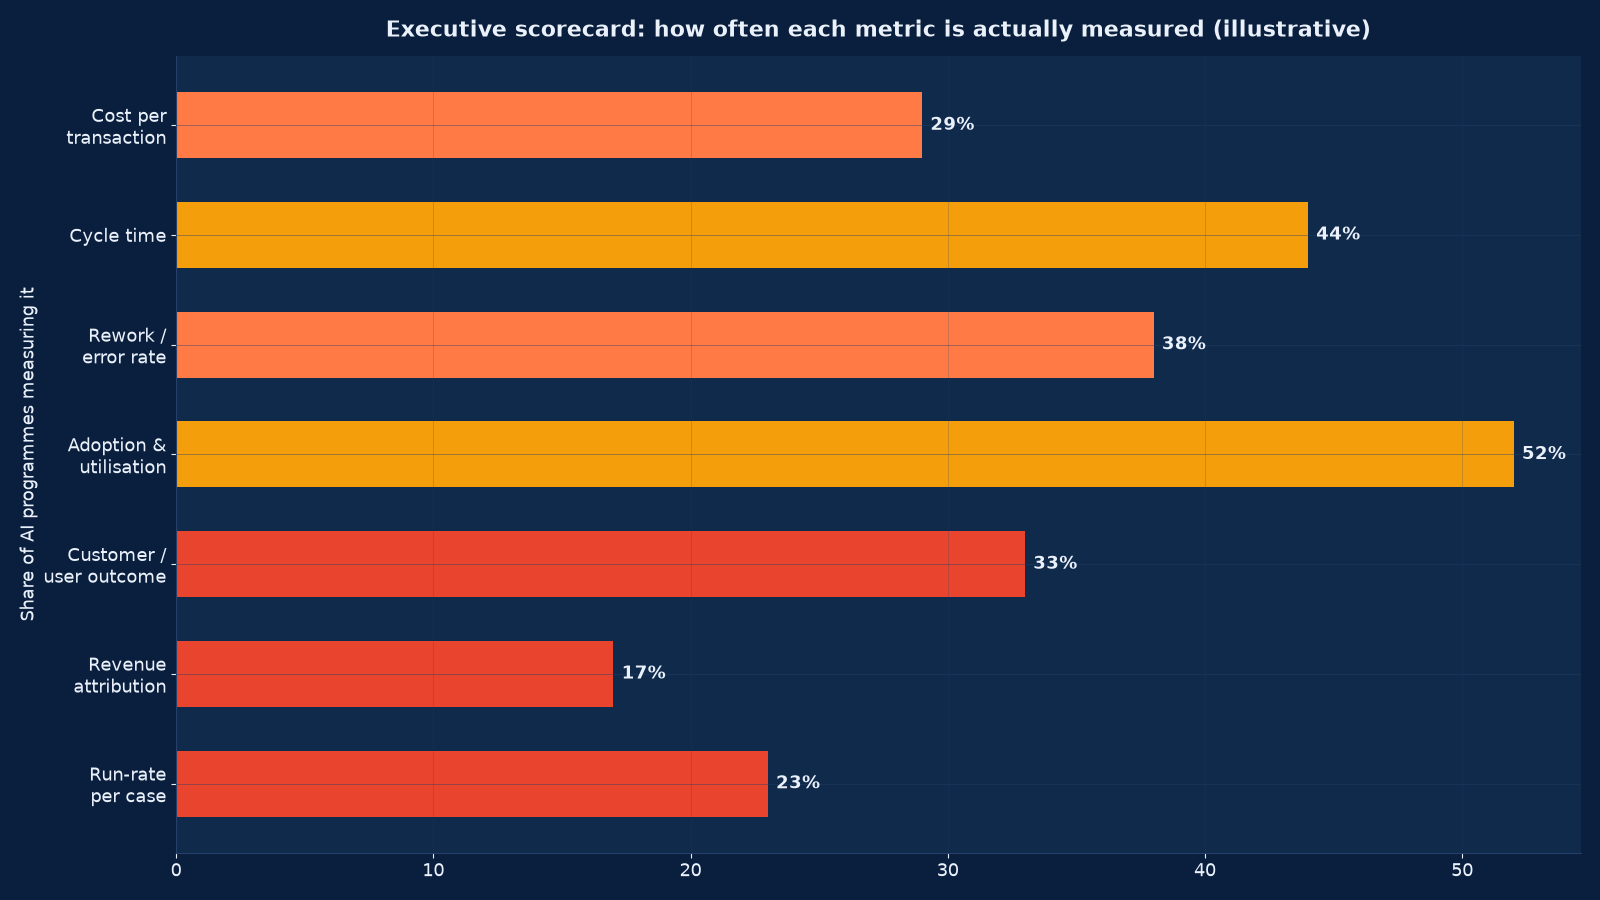
Chart values are an illustrative planning model based on typical UMC engagements and published industry benchmarks. They are not a guarantee of results on any specific project.
Instrumentation: Making the Scorecard Compute Itself
A scorecard maintained by hand dies within two quarters. The measurement layer has to be built into the system, which means treating it as an engineering deliverable with the same rigour as the feature itself.
- Trace every request. Log request id, user or role, input size, model and version, token counts, latency, cost, output status and any downstream override. Without the request id you cannot join AI activity to business outcome.
- Join to the operational system. The business number lives in the ERP, CRM or ticketing system. Carry a correlation key so an AI-assisted order, quote or case can be identified after the fact.
- Capture human review explicitly. Approve, edit, reject and regenerate are four distinct events. Edit distance on the correction tells you how far the model output was from usable.
- Sample for quality. Continuous automated checks plus a rotating human sample — typically 1 to 3% of live traffic, stratified so low-volume edge cases are represented.
- Version the evaluation set. When the model or the prompt changes, re-run the same evaluation set and record the delta. This is what lets you answer “did we get better or did the sample change?”
- Tag cost at source. Cloud and model spend tagged by use case, not by team, so unit economics can be computed per transaction.
- Publish automatically. A scheduled job that writes the scorecard data and notifies owners on variance beats a person remembering to refresh a spreadsheet.
Where the AI sits inside an existing system of record, the correlation key has to be threaded through the integration. That is an architecture question and it is covered in AI Product Engineering for production-ready intelligent products.
Gates, Thresholds and Kill Criteria
Decide the thresholds before the data exists. After the data exists, every threshold becomes negotiable and the negotiation always favours the team that wants the project to continue.
| Gate | Typical timing | Evidence required | Pass condition example |
|---|---|---|---|
| G0 Concept | Week 0 | Problem definition, baseline feasibility, cost estimate | A measurable baseline exists and the expected benefit exceeds 3x full cost over 24 months |
| G1 Pilot | Week 6–12 | Pilot results on live-like data, unit cost, quality sample | First-pass accuracy above the agreed floor and unit cost inside the forecast envelope |
| G2 Production | Week 12–20 | Instrumentation live, runbook, evaluation set, risk review | Scorecard computes automatically and quality is stable over four consecutive weeks |
| G3 Scale | Month 6–9 | Measured benefit against model, adoption trend, cost trend | Realised benefit within 20% of the modelled figure at the agreed adoption level |
| G4 Sustain | Month 12+ | Rolling benefit, drift monitoring, vendor and model changes | Benefit run-rate maintained and unit cost not degrading quarter on quarter |
Write the kill criteria in the same document as the pass conditions. “Retire if adoption is below 30% at month six” is a decision made in advance. “We will review at month six” is not.
Benchmarking and Comparability
Executives ask how your numbers compare with peers. Handle this carefully: published AI ROI benchmarks are usually self-reported, vendor-adjacent and measured on different bases. They are useful for direction and useless for target-setting.
A more defensible comparison is internal and longitudinal. Compare the same process across sites, teams or periods, holding the definition constant. Compare AI-assisted against non-assisted work on matched cases. Where a holdout group is operationally possible, it gives you the only clean attribution you will ever get, and it is worth arguing for even when it is uncomfortable. Our review of ROI-focused optimisation tooling covers the measurement products teams commonly reach for and where each one stops short.
| Comparison method | Strength | Weakness | Use it for |
|---|---|---|---|
| Internal longitudinal | Same definitions, real data | Confounded by other changes over time | Tracking a single process through rollout |
| Matched-case comparison | Controls for case difficulty | Needs disciplined case tagging | Quality and rework claims |
| Holdout group | Cleanest attribution available | Operationally awkward, some staff excluded | Revenue and conversion effects |
| Cross-site comparison | Multiple independent samples | Local variation swamps the AI effect | Multi-location rollouts |
| External benchmark | Fast, no instrumentation needed | Self-reported, incomparable bases | Direction only — never target-setting |
Engagement Models and What Each Delivers
Three ways organisations buy this service, depending on whether they need the measurement designed, built, or independently checked.
| Model | Duration | Deliverables | Best when |
|---|---|---|---|
| ROI framework design | 3–4 weeks | Benefit register, cost model, scorecard specification, gate criteria, instrumentation requirements | Before or during a first production deployment |
| Full instrumentation build | 8–12 weeks | Telemetry implementation, evaluation harness, automated scorecard, owner training | A system is live but the numbers are assembled by hand |
| Independent ROI review | 2–3 weeks | Recalculation of claimed benefit, cost reconciliation, gap report, recommendation to the board | A programme is being scaled, refinanced or challenged |
The independent review is the most frequently requested and the most uncomfortable, because it often finds that a claimed benefit was real but was already going to happen, or that the cost side was understated by the run-rate. That is exactly why it is worth doing before the scale decision rather than after it.
Working With Finance, Audit and the Board
AI ROI reporting has three audiences with different needs and they must be served from one consistent data set. Finance wants cost certainty and a reproducible calculation. Audit wants an evidence trail and a documented method. The board wants a direction of travel and a decision to approve.
- One source of truth. A single benefit register that finance can reconcile to the ledger and that the scorecard reads from. No parallel spreadsheets.
- Written method. How each metric is computed, from which system, over which window, with which exclusions. Reproducibility is what makes a number auditable.
- Explicit uncertainty. Show the base case with a range and the stalled-adoption scenario. A single point estimate invites a single point challenge.
- Separate realised from projected. Realised benefit to date, run-rate, and projected lifetime benefit are three different numbers and are routinely conflated.
- Name the owner. Every line in the benefit register is owned by a named person in the business, not by the AI team. The AI team reports; the business owns the number.
- Report failures too. Retired use cases with the reason recorded build far more credibility than an unbroken list of successes.
Where the scorecard carries a risk column, that column should be fed by the same process that produces your control documentation. AI Governance, Risk & Compliance Services explains how we connect incident, audit and control data into a single view.
Common Metrics and Their Definitions
Definitions matter more than the numbers. Two teams reporting “accuracy” can be measuring entirely different things and both can be right.
| Metric | Definition we use | Pitfall to avoid |
|---|---|---|
| First-pass acceptance rate | Share of AI outputs accepted without human edit | Counting “no complaint” as acceptance |
| Override rate | Share of outputs materially changed by a human | Ignoring small edits that still cost time |
| Cost per transaction | All-in cost including inference, retrieval, supervision and rework, divided by completed transactions | Using inference cost alone |
| Net effort saved | Gross time saved minus supervision, review and correction time | Claiming gross saving as net |
| Adoption | Eligible occurrences actually routed through the AI in the period | Counting registered users instead of used occurrences |
| Time to value | Weeks from go-live to first measurable benefit above the threshold | Starting the clock at project kickoff |
| Benefit realisation | Realised benefit divided by modelled benefit at the same adoption level | Comparing realised benefit to a model assuming full adoption |
| Quality escape rate | Defects found downstream rather than at the review point | Only measuring defects caught in review |
Delivery Timeline
A typical engagement runs twelve weeks from baseline to an automated scorecard, though the framework-only route finishes in four.
| Phase | Weeks | Activities | Output |
|---|---|---|---|
| Discovery & baseline | 1–2 | Stakeholder interviews, process mapping, baseline measurement from operational systems | Baseline document signed off by the process owner |
| Benefit & cost modelling | 2–4 | Bottom-up benefit model per use case, full cost model, sensitivity and scenarios | Business case pack with stated assumptions |
| Scorecard design | 4–5 | Metric selection, definitions, owners, cadence, layout, gate criteria | Scorecard specification |
| Instrumentation | 5–9 | Telemetry, correlation keys, review capture, quality sampling, cost tagging | Live data pipeline feeding the scorecard |
| Evaluation & verification | 9–11 | Independent recalculation, sample verification against source records, method write-up | Verification note and audit trail |
| Handover & cadence | 11–12 | Owner training, publication automation, first two cycles run with support | Operating scorecard and runbook |
What Success Looks Like at Month Six
If the service has worked, the conversation in the room changes. Instead of asking whether the AI is any good, the executive team asks which use case to fund next, what the marginal cost of volume is, and whether the quality trend justifies removing a review step. Those are decision questions, and they are only answerable with a measurement layer underneath.
Concretely, at month six you should have: a signed-off baseline nobody disputes; a scorecard that refreshes without human effort; a benefit register finance has reconciled; unit economics per use case that let you price internal chargeback if you choose; a documented evaluation set that makes model changes safe; and at least one use case retired on evidence, which is the clearest sign the process is honest rather than promotional.
Organisations that get here tend to scale faster afterwards, because the scale decision stops being an argument about belief. Our guide to how industries must operate in the AI era sets this measurement capability in the wider context of operating-model change.
Frequently Asked Questions About AI ROI Measurement & Executive Scorecards
How long does it take to establish a defensible baseline?
Two to four weeks for a single process, assuming the operational system already records timestamps and volumes. Where records are incomplete, a short time study on a stratified sample is faster than waiting for perfect data — thirty to fifty observed occurrences usually gives a usable figure with a stated confidence range.
Can you measure ROI on an AI programme that is already live?
Yes, and this is the most common request. We reconstruct the baseline from historical records, matched-case comparison or a cross-sectional comparison between teams that adopted and teams that did not. The result is less precise than a pre-instrumented baseline but still defensible if the method is written down and the limitations stated.
What is a realistic payback period for AI in a business process?
For well-scoped process automation with an adoption push, six to fourteen months to recover full first-year cost is typical. Programmes that assume payback in under three months usually model 100% adoption from go-live and omit supervision and run-rate cost. We would rather show you a twelve-month payback you can hit than a three-month one you cannot.
Should the scorecard include risk metrics?
Yes. A value-only scorecard quietly encourages the team to take risks nobody is watching. Two or three risk indicators — open incidents, audit findings, policy exceptions — keep the value and the exposure in the same frame, which is how the board actually thinks.
How do you handle benefit that is only reclaimed time?
Report it separately from hard savings and state the redeployment decision explicitly. Reclaimed time becomes real money when the business either reduces cost, avoids a hire, or absorbs more volume without adding people. If none of those decisions is taken, it is a productivity improvement, not a saving, and the scorecard should say so.
Who should own the scorecard?
A business owner, not the AI team. The AI team builds and maintains the instrumentation; a named executive owns the numbers and chairs the review. When the delivery team owns its own scorecard, the incentive to present favourable numbers is unavoidable.
Do we need a dedicated analytics platform for this?
Not initially. For most mid-sized programmes, event logging into the existing warehouse plus a scheduled reporting job is enough, and it is far cheaper than a new platform. A dedicated analytics stack is only worth it once volume or the number of use cases makes the query load unsustainable — our Cloud Services Migration for AWS, Azure and GCP cover that transition when the time comes.
How often should the scorecard be reviewed?
Monthly for value, cost and adoption; fortnightly for quality while a use case is new; quarterly at gate level with a scale, hold or retire recommendation per use case. Reviewing more often than the underlying data changes produces noise and erodes trust in the numbers.
What if the numbers show the programme is not working?
That is a successful measurement outcome, not a failure. Retire or re-scope the use case, record the reason, and redeploy the budget. Programmes that can show a retired use case with evidence attached are the ones that get funded again, because leadership trusts the numbers.
Can this be combined with an existing BI or reporting tool?
Almost always. We write the metric definitions and the ingestion logic so they land in the tools you already run, rather than introducing a parallel reporting estate. Where you also need deeper analytical work on top, see Data Science Services for Business Analytics.
Book an AI ROI Working Session
Bring one live or planned AI use case and we will work through the baseline, the benefit model and the first version of the scorecard with your finance and process owners in the room. Most organisations leave that session with a defensible number for the first time, and a clear view of what instrumentation is missing.
Contact Unified Management Consulting to book an initial working session on your AI programme.
Related Services
AI ROI measurement sits inside a wider delivery set. These services are usually engaged alongside it:
- AI Readiness Assessment & Roadmap — prioritisation and sequencing before you commit spend
- AI Governance, Risk & Compliance — the control and risk evidence behind the scorecard’s risk column
- AI Agent Deployment & Automation — production deployment where the unit economics get tested
- AI Product Engineering for Production-Ready Intelligent Products — the instrumentation and architecture that make measurement possible
- AI Forward-Deployed Engineering Services — embedded engineers who build the measurement layer with your team
- Data Science Services for Business Analytics — deeper analytical work on top of the scorecard data
- Measuring AI ROI: Building an Executive Scorecard — the practitioner guide behind this service
- Data Engineering for AI: RAG & Knowledge System Services — source audit, ingestion connectors, cleaning and metadata, permission-aware retrieval and the evaluation harness that proves every answer is grounded
- AI Integration Services for ERP, CRM & Operations — embed AI into ERP, CRM and operational systems with mapped permissions, supervised writes, immutable action logging and a tested rollback path
- AI Training & Enablement Services for Teams — role-based enablement, a measured capability baseline, build clinics and a champion network that makes adoption stick after delivery